Fig. 2
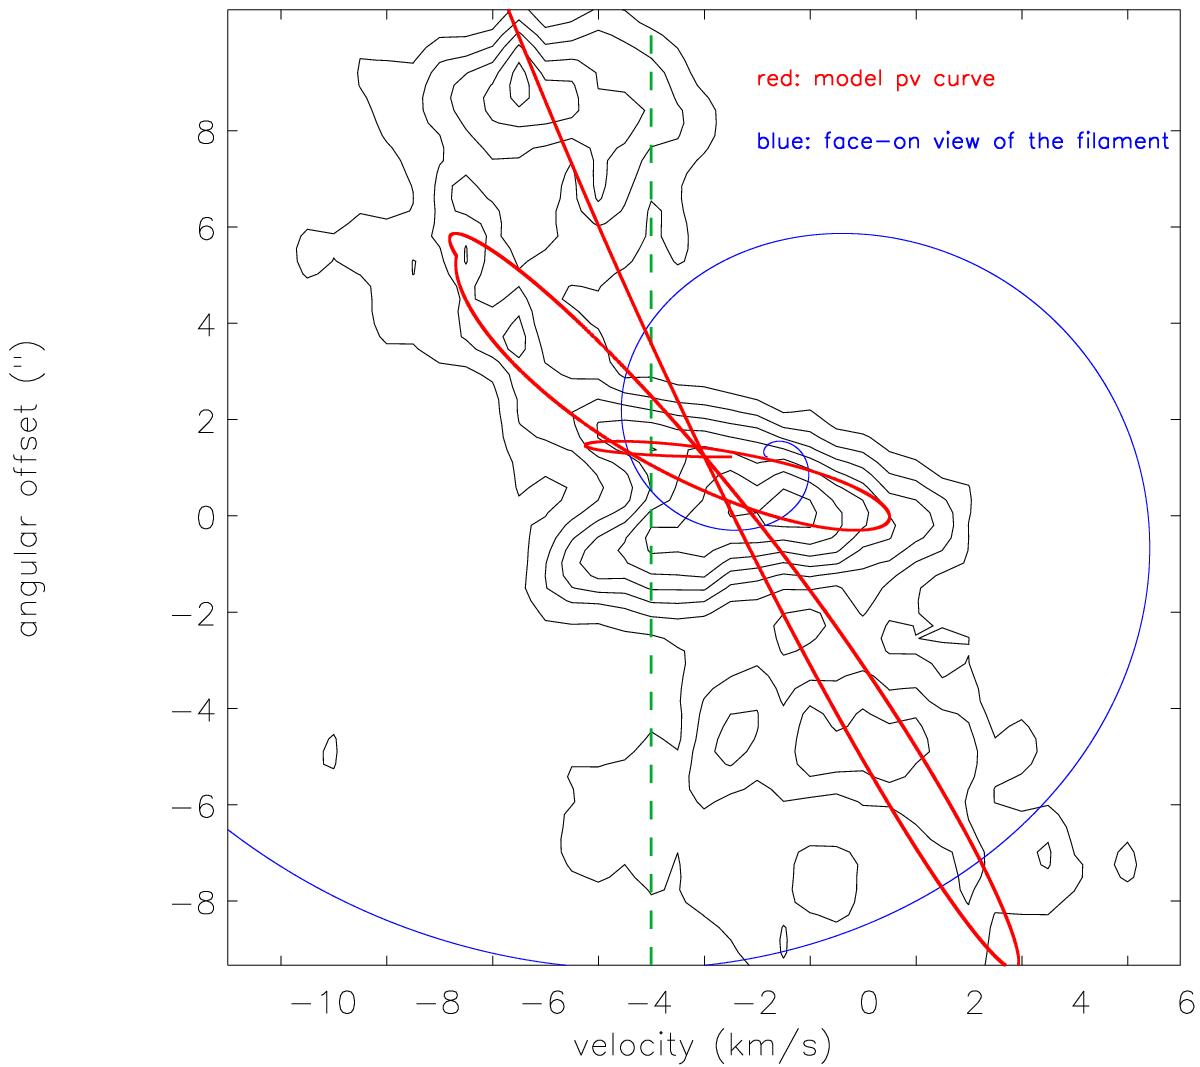
Position-velocity diagram of the CH3OH 50,5–40,4 E transition in OB cluster forming region G10.6-0.4 (contour; see Fig. 3 of Liu et al. 2011 for the comparisons with other CH3OH excitation levels and the NH3 (3, 3) hyperfine lines), and the model PV curve (red curve). The pv cut is centered at the coordinates of RA = 18h10m28.64s and Dec = −19°55′49.22′′ with position angle PA = 140°. Positive angular offsets are southeast of the center. Contour levels are 0.36 Jy beam-1 × [ 1, 2, 3, 4, 5, 6, 7]. The resolution of this CH3OH observation is 1.̋5 × 1.̋3, and the rms noise level is 0.06 Jy beam-1. The dashed line marks the cloud systemic velocity of −3 km s-1. The face-on view of the model filamentary spiral structure is also plotted on the same physical scale (blue curve; assuming observers are viewing this structure from the left, and assuming the same spatial scales in the horizontal and vertical directions).
Current usage metrics show cumulative count of Article Views (full-text article views including HTML views, PDF and ePub downloads, according to the available data) and Abstracts Views on Vision4Press platform.
Data correspond to usage on the plateform after 2015. The current usage metrics is available 48-96 hours after online publication and is updated daily on week days.
Initial download of the metrics may take a while.