Fig. 1

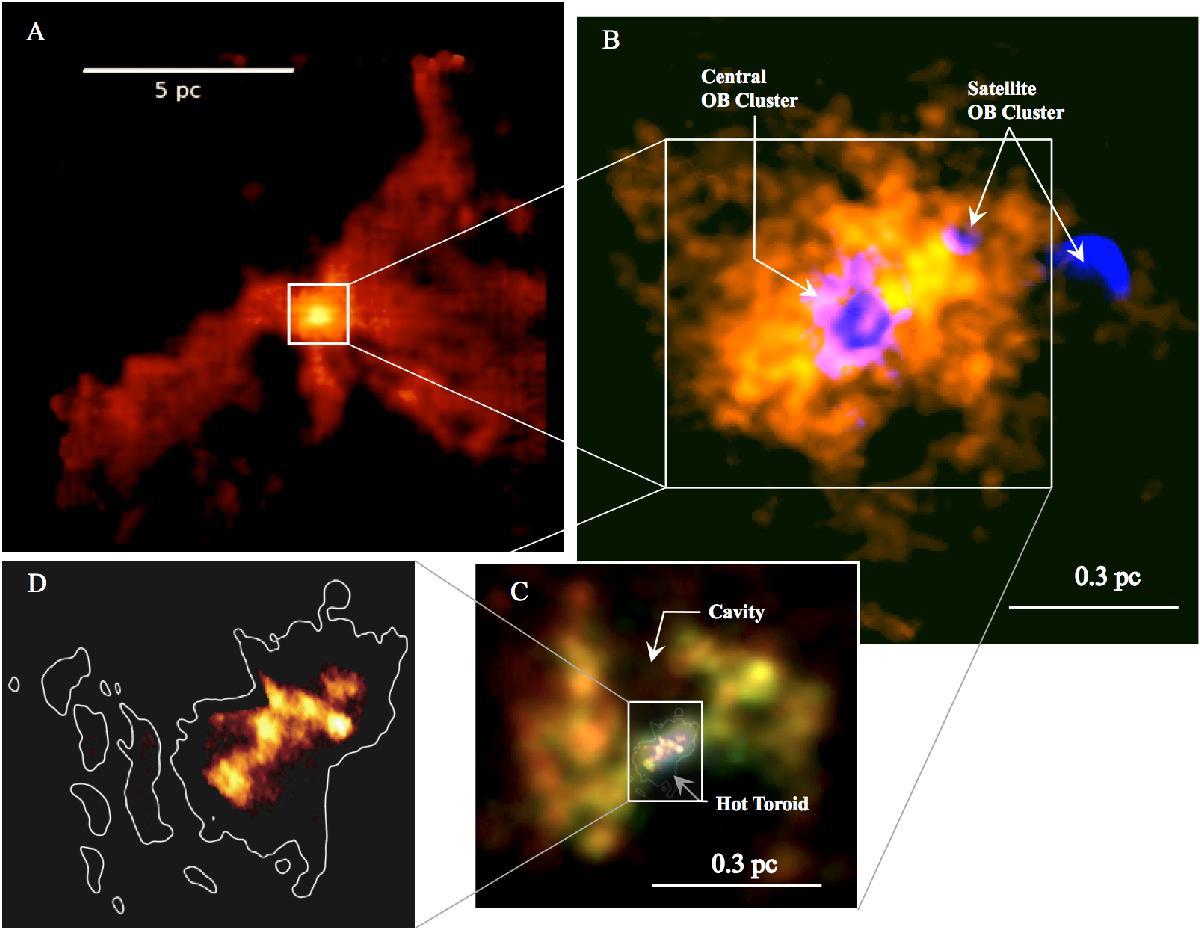
Gas structures in OB cluster-forming region G10.6-0.4. A) IRAM-30 m telescope observations of 13CO 2–1, integrated from −3 to 0.6 km s-1 (Liu et al., in prep.). We omit integrating the blueshifted component in this panel to avoid confusing the gas structures due to blending. B) Color composite image made from the VLA observations of the CS 1–0 line (orange) and the 3.6 cm continuum emission (blue), which were presented in Liu et al. (2011). The deficit of CS 1–0 emission at the center is due to absorption line against the bright UC Hii region. C) Color composite image made from the SMA observations of three CH3OH transitions, which trace 35 K (red), 60 K (green), and 97 K (blue) upper level energy, respectively. Inset overlays the VLA observations of the optical depth map of the NH3 (3, 3) satellite hyperfine line, which was reproduced from Sollins & Ho (2005). D) VLA (A-array configuration) image of NH3 (3, 3) satellite hyperfine line optical depth map (Sollins & Ho 2005).
Current usage metrics show cumulative count of Article Views (full-text article views including HTML views, PDF and ePub downloads, according to the available data) and Abstracts Views on Vision4Press platform.
Data correspond to usage on the plateform after 2015. The current usage metrics is available 48-96 hours after online publication and is updated daily on week days.
Initial download of the metrics may take a while.


