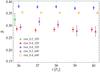
Fig. 5
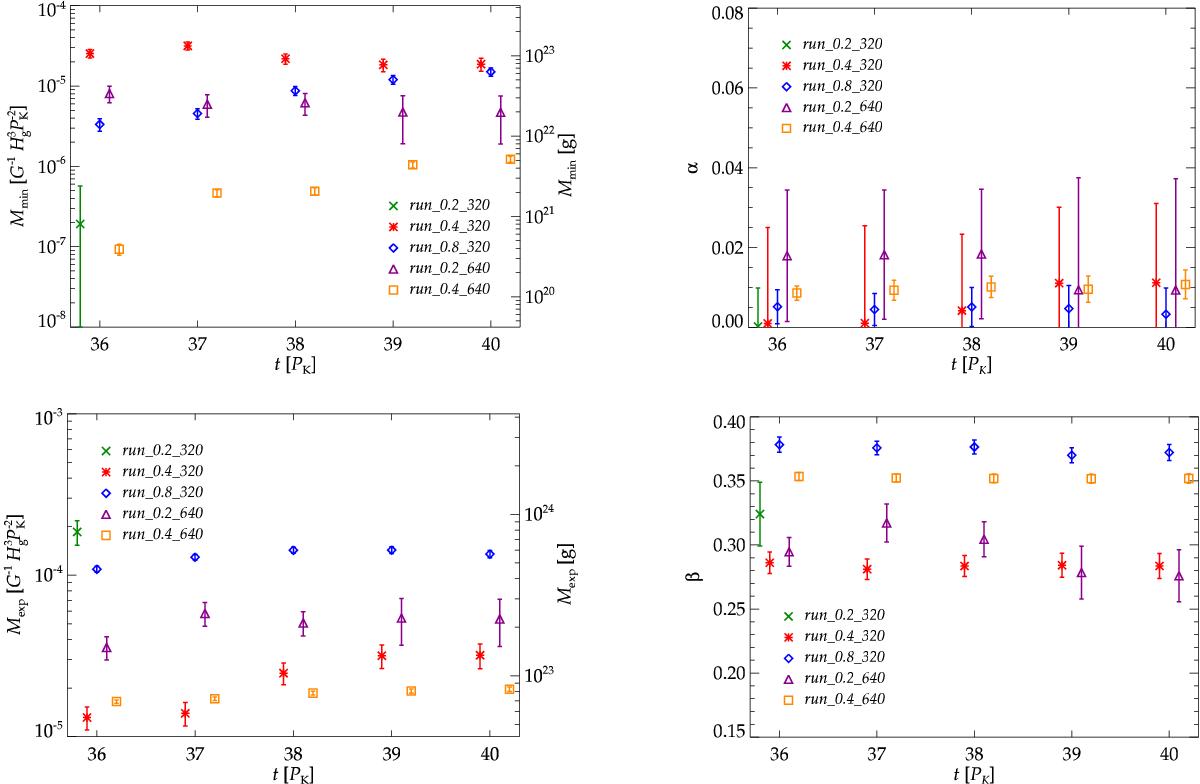
Best-fitting parameters Mmin (upper left panel), α (upper right panel), Mexp (lower left panel), and β (lower right panel) of the exponentially tapered power law (Eq. (19)) at every Keplerian orbital period between t = 36 PK and t = 40 PK for all five simulations. Standard errors are plotted as error bars. In the case of the simulation with the smallest box size and the lower resolution, run_0.2_320, only parameter values for t = 36 PK are plotted because afterwards only four sink particles persist, which prevents us from properly fitting the mass distributions with a power law and an exponential tapering.
Current usage metrics show cumulative count of Article Views (full-text article views including HTML views, PDF and ePub downloads, according to the available data) and Abstracts Views on Vision4Press platform.
Data correspond to usage on the plateform after 2015. The current usage metrics is available 48-96 hours after online publication and is updated daily on week days.
Initial download of the metrics may take a while.