Fig. 4
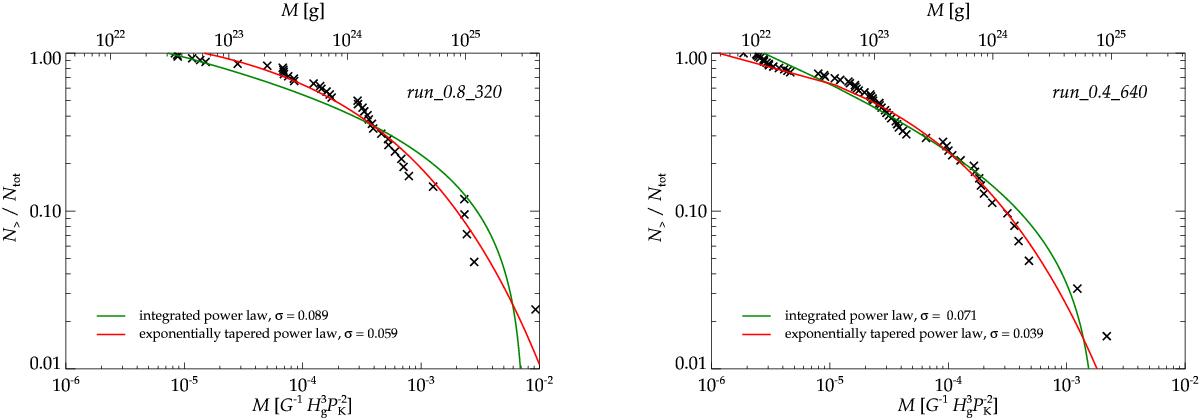
Cumulative mass distributions of sink particles (black crosses) and fitted integrated power laws (Eq. (16), green lines) and power laws with exponential cutoff (Eq. (19), red lines) at t = 40 PK for the two simulations with the largest numbers of sink particles: the one with the largest box dimensions, run_0.8_320, (left panel) and the one with the middle box dimensions and the higher resolution, run_0.4_640 (right panel). Standard deviations of the actual N>/Ntot (black crosses) from the fitted N>/Ntot are given in the legends. The standard deviations for the integrated power laws are up to twice as large as those for the exponentially tapered power laws. In addition, it can be seen that the shallower exponential cutoffs fit the actual cutoffs more accurately than the steeper cutoffs of the integrated power laws and better replicate the smooth change of the slope of the mass distributions. We thus find the power laws with exponential tapering to represent the mass distributions better than the integrated power laws.
Current usage metrics show cumulative count of Article Views (full-text article views including HTML views, PDF and ePub downloads, according to the available data) and Abstracts Views on Vision4Press platform.
Data correspond to usage on the plateform after 2015. The current usage metrics is available 48-96 hours after online publication and is updated daily on week days.
Initial download of the metrics may take a while.