Fig. 2
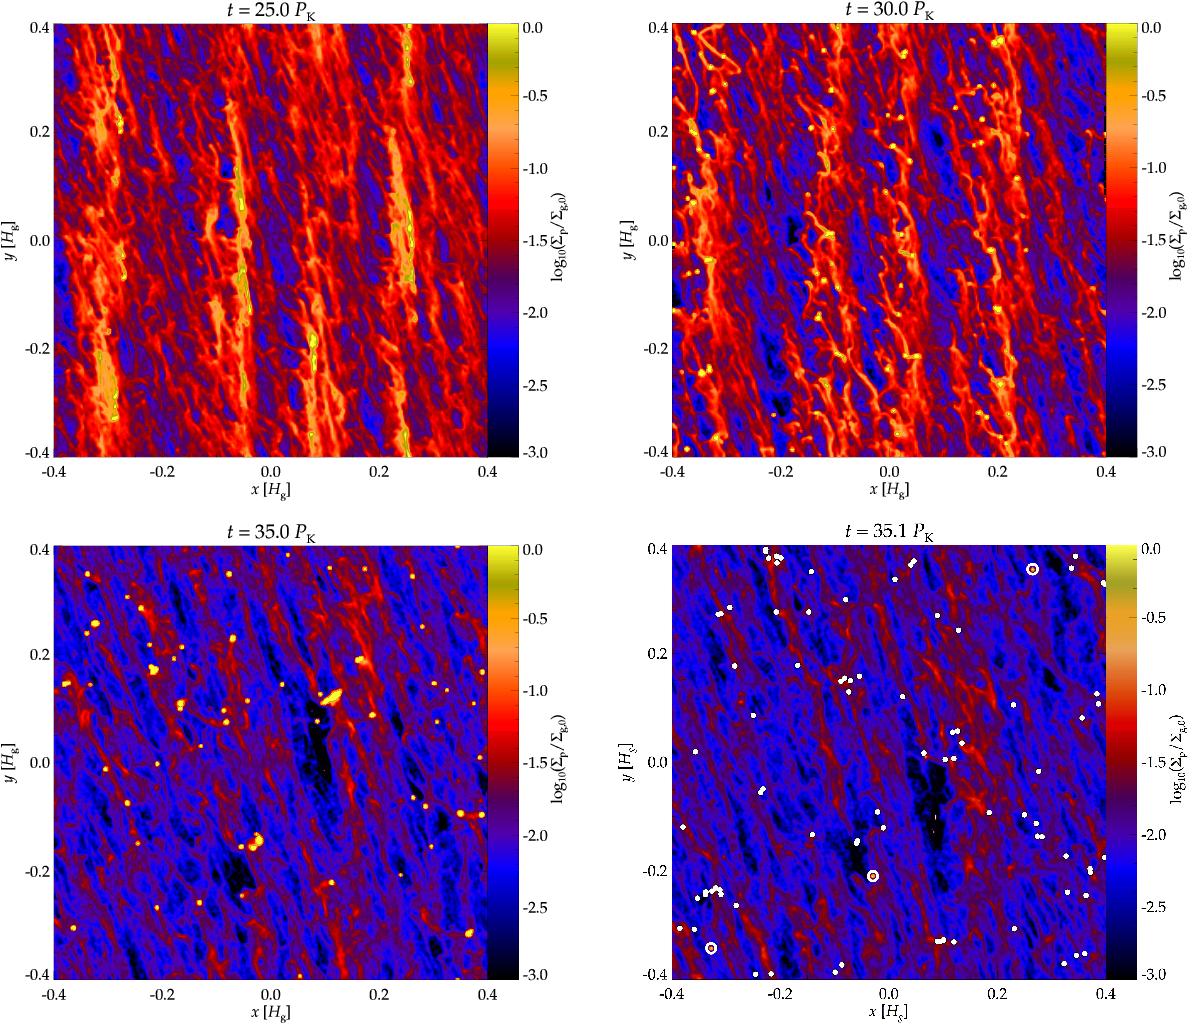
Pebble column density Σp, integrated over the vertical dimension of the simulation box, as a function of radial location x and azimuthal location y at four different simulation times t = 25 PK (top left panel), t = 30 PK (top right panel), t = 35 PK (bottom left panel), and t = 35.1 PK (bottom right panel) for the simulation with the largest box size, run_0.8_320. In the lower right panel, sink particles are plotted as white dots and three pebble clusters are indicated using white circles. After self-gravity has been initiated at t = 25 PK, the pebbles aggregate into clusters and the axisymmetric filaments disperse (upper panels). When the self-gravity attains its full strength at t = 35 PK, most pebbles are concentrated in clusters and the filaments are no longer visible (lower left panel). At this point, we introduce the formation of sink particles, and the pebbles comprised in all but the three encircled clusters are replaced by sink particles. The sink particles emerging from the same pebble cluster undergo a merging process until only one of them remains. This process is largely completed at t = 35.1 PK (lower right panel).
Current usage metrics show cumulative count of Article Views (full-text article views including HTML views, PDF and ePub downloads, according to the available data) and Abstracts Views on Vision4Press platform.
Data correspond to usage on the plateform after 2015. The current usage metrics is available 48-96 hours after online publication and is updated daily on week days.
Initial download of the metrics may take a while.