Fig. 8
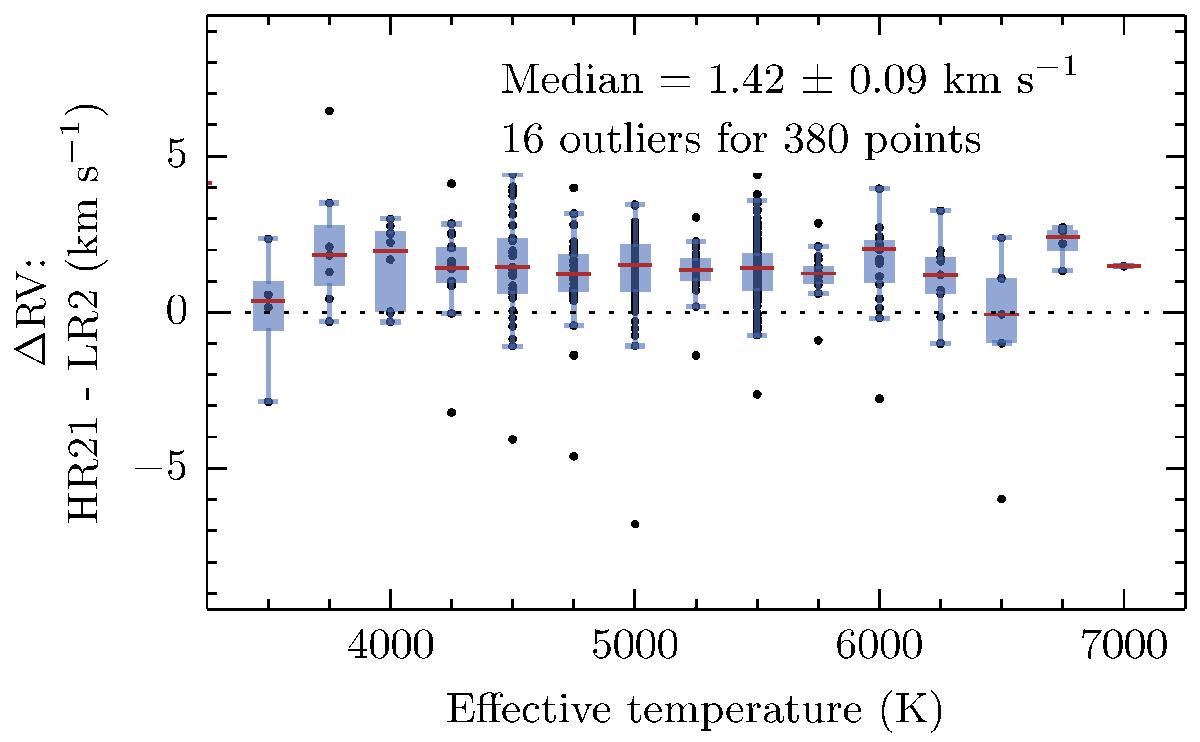
Determination of the RV bias between HR21 and LR2: differences between the star per star RV median derived in HR21 and LR2 are plotted against the effective temperature (dark blue points). The blue boxes extend from the lower to the upper quartile, while the whiskers cover the range of values without outliers from which the median was computed (red horizontal bar). The median of the differences, its standard deviation, and the number of outliers according to Chauvenet’s criterion are provided.
Current usage metrics show cumulative count of Article Views (full-text article views including HTML views, PDF and ePub downloads, according to the available data) and Abstracts Views on Vision4Press platform.
Data correspond to usage on the plateform after 2015. The current usage metrics is available 48-96 hours after online publication and is updated daily on week days.
Initial download of the metrics may take a while.