Fig. 7
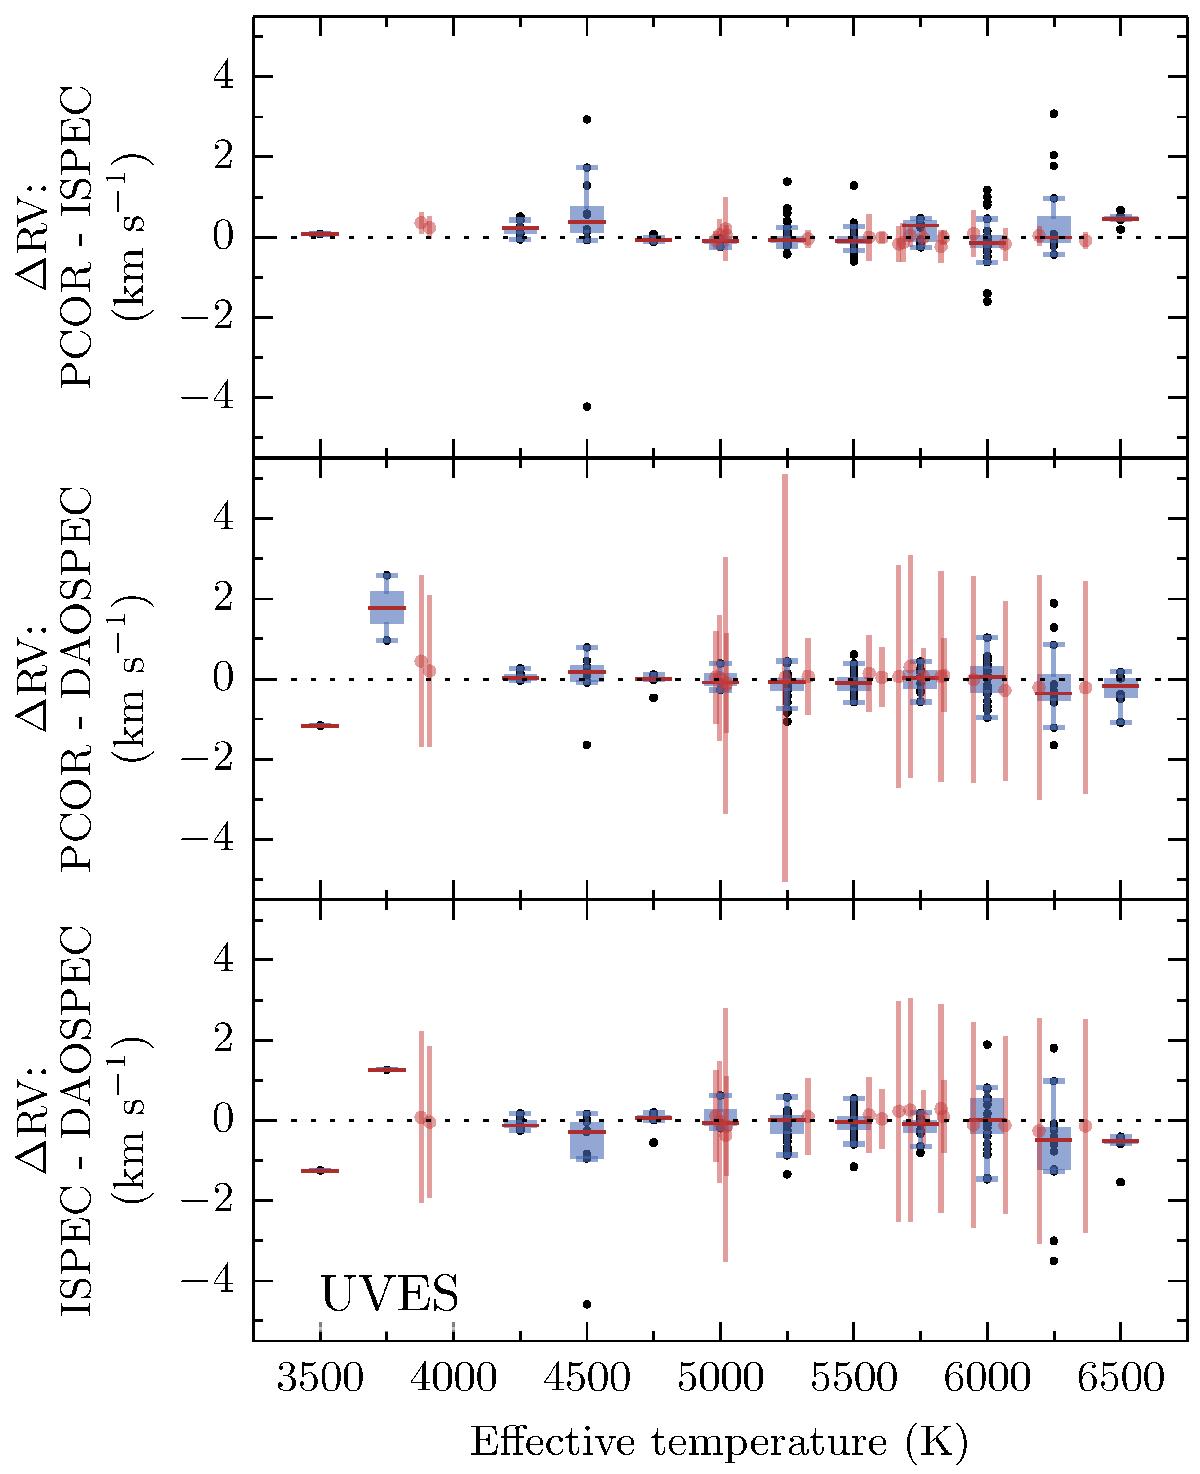
Method to method comparisons for the UVES data: RV differences are plotted against the effective temperature. The blue points are the measurements obtained for the SEP targets, while the red disks represent the Gaia RV standards. The blue boxes extend from the lower to the upper quartile, while the whiskers cover the range of values without outliers from which the median was computed (red horizontal bar). The Teff is taken from the results of the template optimisation with PCOR (Sect. 4.1.2).
Current usage metrics show cumulative count of Article Views (full-text article views including HTML views, PDF and ePub downloads, according to the available data) and Abstracts Views on Vision4Press platform.
Data correspond to usage on the plateform after 2015. The current usage metrics is available 48-96 hours after online publication and is updated daily on week days.
Initial download of the metrics may take a while.