Fig. 10
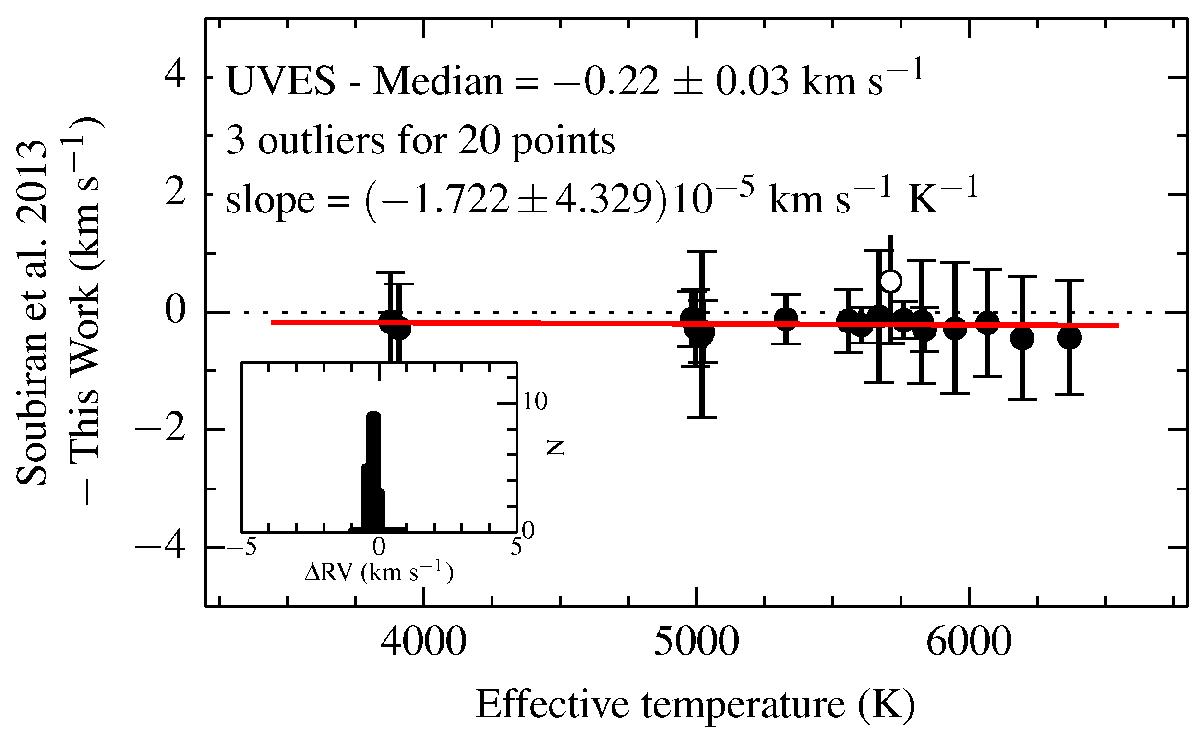
Gaia RV standard stars: comparison between UVES RV measurements (this work) and those found in the Soubiran et al. (2013) catalogue. The median of the differences and the corresponding standard deviation are provided, as well as the slope of the best line drawn (red line) through the points. The histogram distribution of the deviations are provided in the figure inset. Outliers were filtered out by applying Chauvenet’s criterion.
Current usage metrics show cumulative count of Article Views (full-text article views including HTML views, PDF and ePub downloads, according to the available data) and Abstracts Views on Vision4Press platform.
Data correspond to usage on the plateform after 2015. The current usage metrics is available 48-96 hours after online publication and is updated daily on week days.
Initial download of the metrics may take a while.