Fig. 8
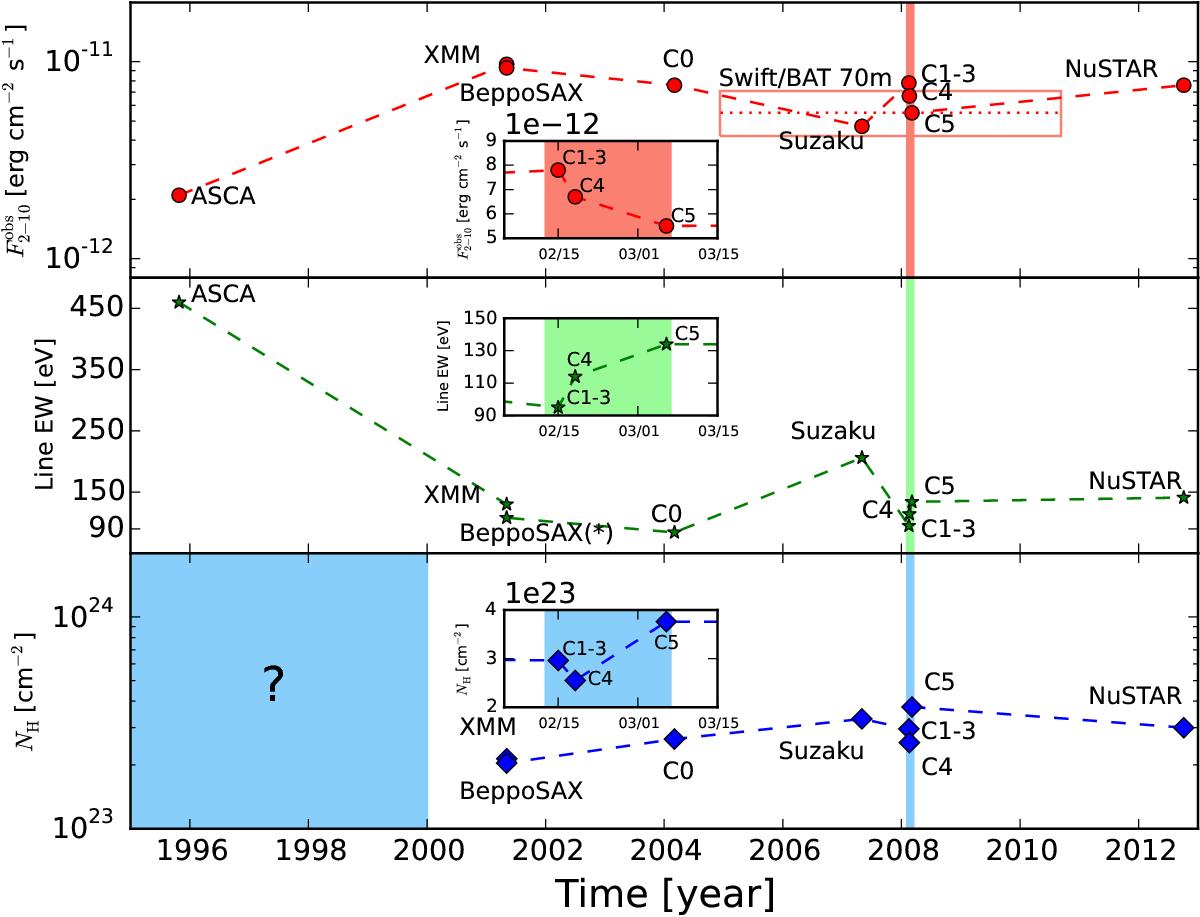
Observed flux in the 2−10 keV band of Mrk 1210 (top panel), Fe Kα line equivalent width (middle panel) and column density (bottom panel) as a function of time. The inset panels show the zoomed-in region of the five Chandra observations during 2008. (*) We report here the equivalent width of model 1 instead of that of model 2 in Ohno et al. (2004). The two values are consistent within the uncertainties, and we adopt the more constrained one for clarity.
Current usage metrics show cumulative count of Article Views (full-text article views including HTML views, PDF and ePub downloads, according to the available data) and Abstracts Views on Vision4Press platform.
Data correspond to usage on the plateform after 2015. The current usage metrics is available 48-96 hours after online publication and is updated daily on week days.
Initial download of the metrics may take a while.