Fig. 1
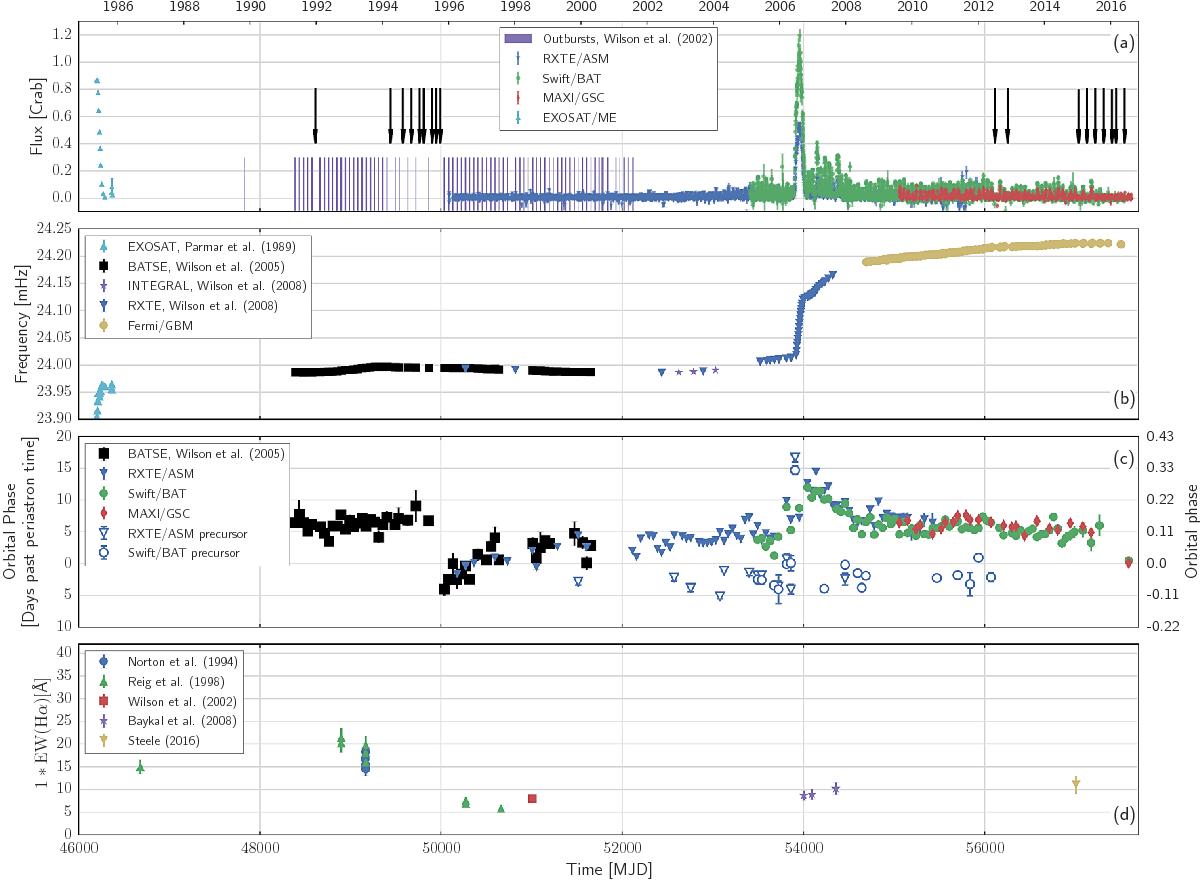
Overview of the long-term evolution of EXO 2030+375. a) Long-term history of the X-ray light curve rescaled to the Crab flux; black arrows indicate missed type I outbursts. Outbursts listed in Wilson et al. (2002) are indicated as violet rectangles. The width of the rectangle corresponds to the outburst timescale. b) Long-term history of the spin period from Wilson et al. (2005, 2008) and Fermi/GBM data. The error bars are smaller than the symbols. c) Peak outburst time with respect to the periastron passage time and peak precursor peak time with respect to periastron passage time determined with the method described in the text. d) Long-term history of the Hα line equivalent width from various authors. Detailed information is given in the text.
Current usage metrics show cumulative count of Article Views (full-text article views including HTML views, PDF and ePub downloads, according to the available data) and Abstracts Views on Vision4Press platform.
Data correspond to usage on the plateform after 2015. The current usage metrics is available 48-96 hours after online publication and is updated daily on week days.
Initial download of the metrics may take a while.