Free Access
Fig. 5
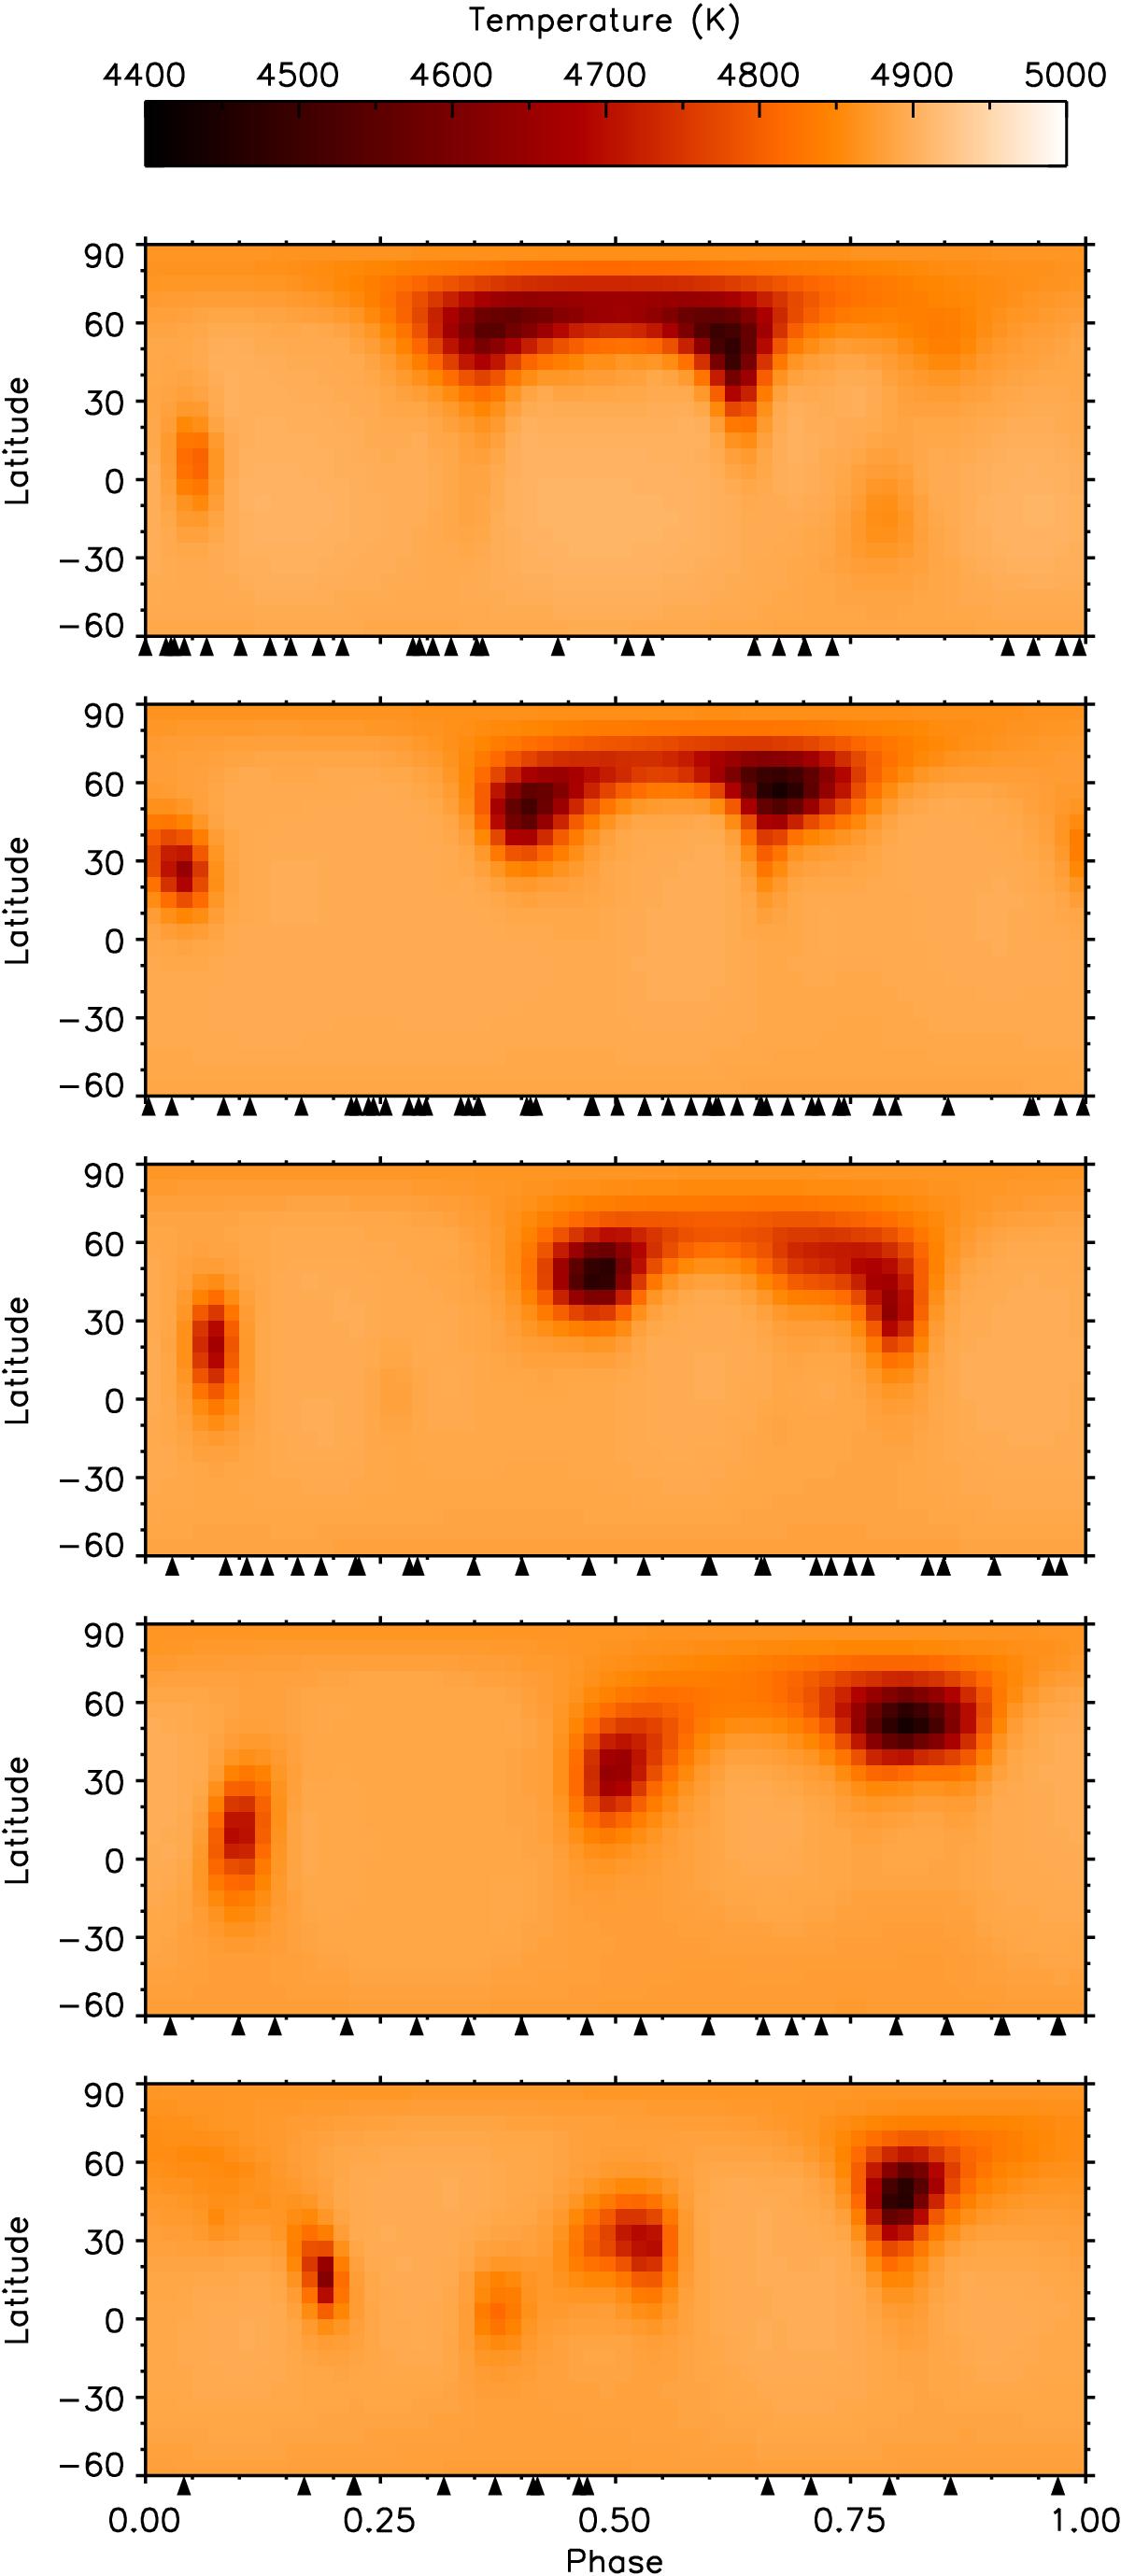
Time series of Doppler maps for the period December 2011−April 2012. Chronological order from top to bottom. Time intervals covered by each map are given in Table 2. Arrows at the bottom of each panel indicate the phase coverage. Spots are dubbed S1, S2, and S3 from left to right in the top panel.
Current usage metrics show cumulative count of Article Views (full-text article views including HTML views, PDF and ePub downloads, according to the available data) and Abstracts Views on Vision4Press platform.
Data correspond to usage on the plateform after 2015. The current usage metrics is available 48-96 hours after online publication and is updated daily on week days.
Initial download of the metrics may take a while.