Fig. 4
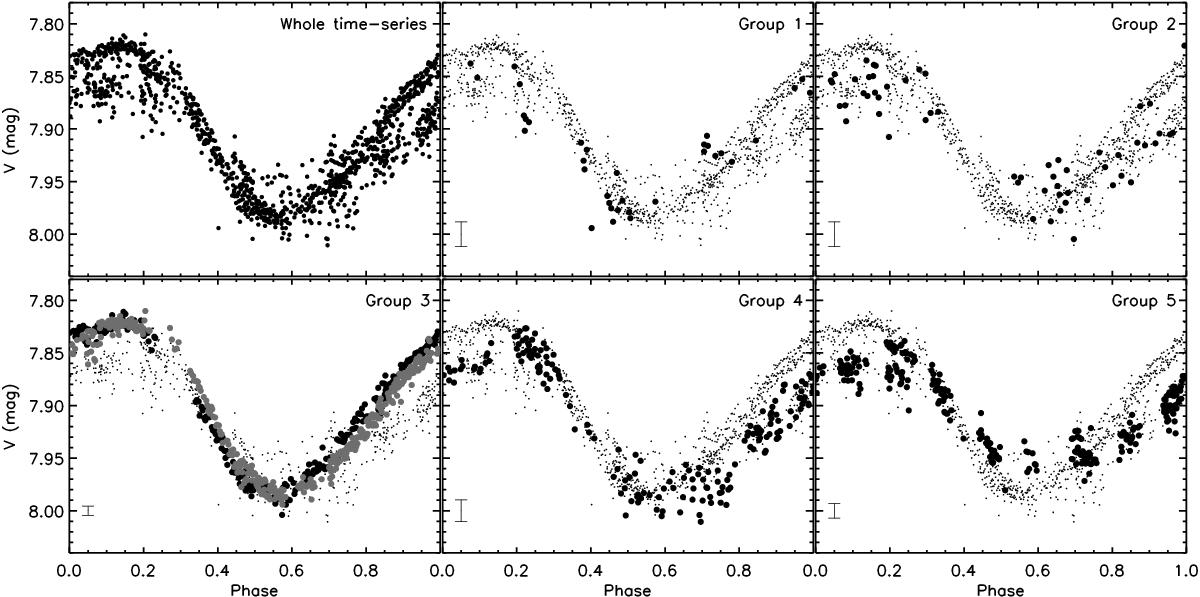
Rotational modulation of the V-band photometry at different time intervals. Top left: for the whole time-series. Top middle: for days 0 to 21. Top right: for days 22 to 53. Bottom left: for days 54 to 66 (black circles) and for days 67 to 80 (gray circles). Bottom middle: for days 81 to 102. Bottom right: for days 103 to 140. Average error bars for each group are given in the lower left corner of each panel. Small dots correspond to the measurements of the whole time-series and are included as a reference to facilitate the comparison. Times in calendar dates are available in Table 2.
Current usage metrics show cumulative count of Article Views (full-text article views including HTML views, PDF and ePub downloads, according to the available data) and Abstracts Views on Vision4Press platform.
Data correspond to usage on the plateform after 2015. The current usage metrics is available 48-96 hours after online publication and is updated daily on week days.
Initial download of the metrics may take a while.