Fig. 3
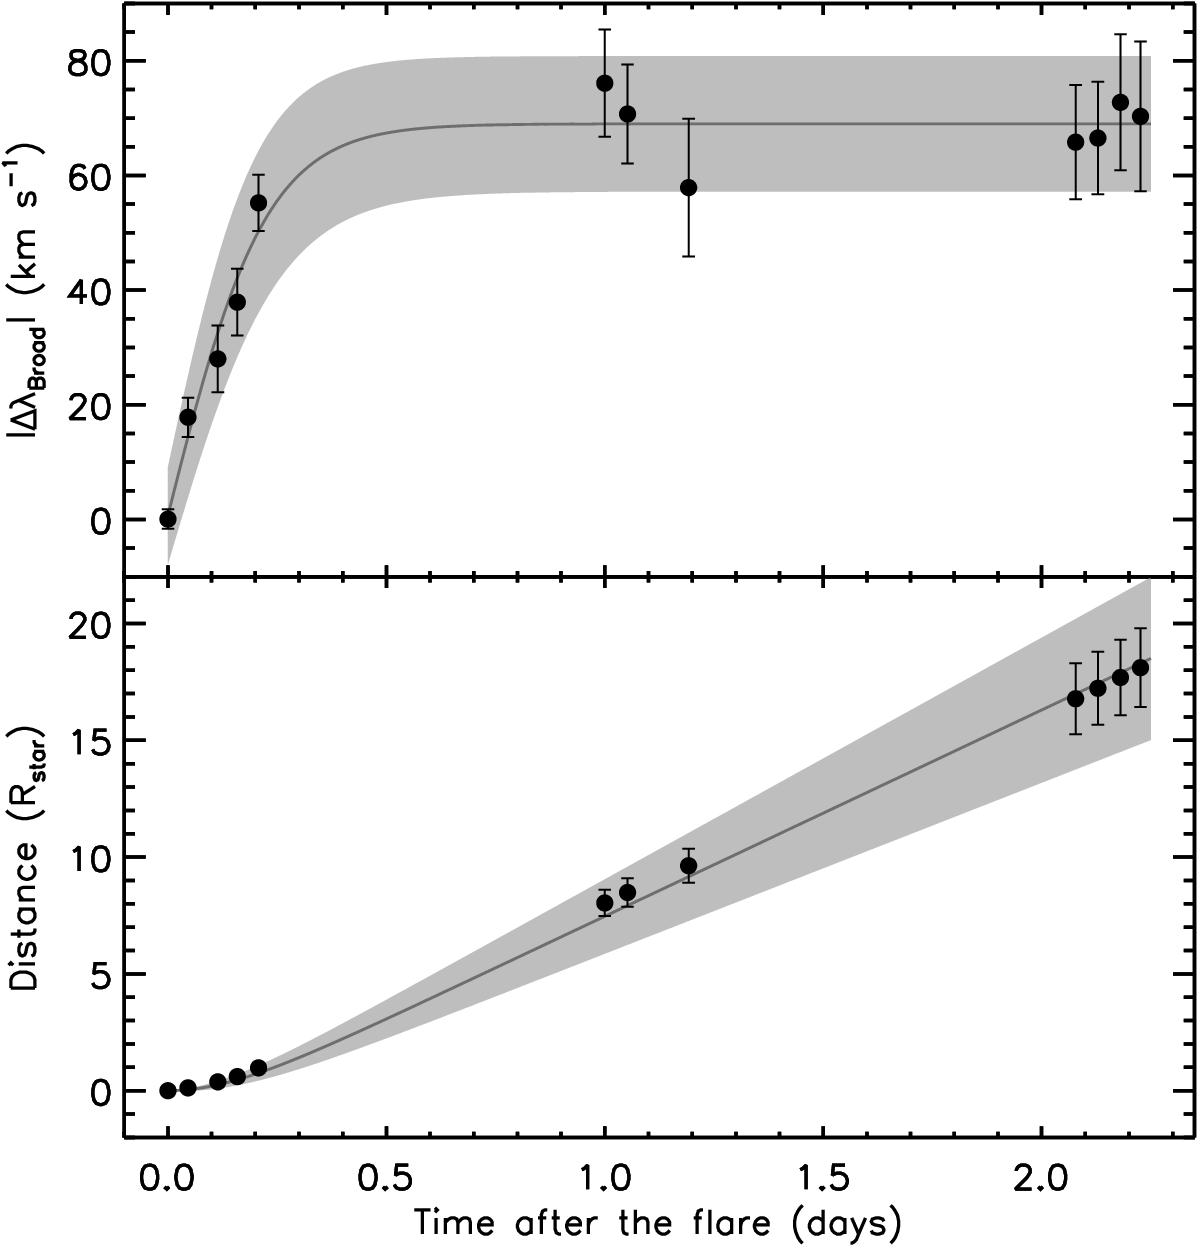
Top: absolute shift of the broad Gaussian component of the Hα line from Fig. 2, in velocity scale. The data have been fit to Eq. (1) (solid line). The gray area indicates the 95% confidence intervals of the fit. Bottom: distance traveled by the source of the broad component under the assumption that it corresponds to ejected material. Data points are from the numerical integration of the velocity measurements. The solid line is the integral of the function used to fit the velocities.
Current usage metrics show cumulative count of Article Views (full-text article views including HTML views, PDF and ePub downloads, according to the available data) and Abstracts Views on Vision4Press platform.
Data correspond to usage on the plateform after 2015. The current usage metrics is available 48-96 hours after online publication and is updated daily on week days.
Initial download of the metrics may take a while.