Free Access
Fig. C.1
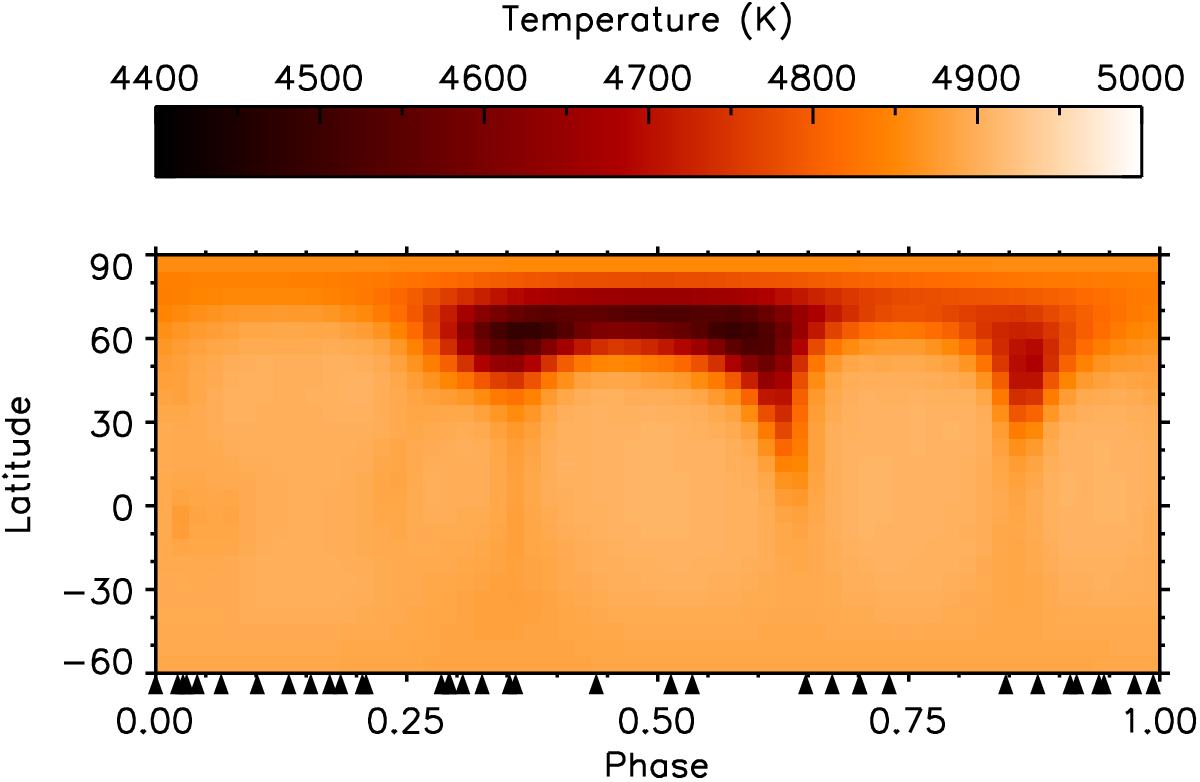
Doppler map computed in the same manner as the first map in Fig. 5, but including seven spectra affected by a possible mass ejection from a flare. As a result of this, the near equatorial spot from phase 0.1 disappears, the resolution at high latitudes get worse, and an artifact near phase 0.85 appears.
Current usage metrics show cumulative count of Article Views (full-text article views including HTML views, PDF and ePub downloads, according to the available data) and Abstracts Views on Vision4Press platform.
Data correspond to usage on the plateform after 2015. The current usage metrics is available 48-96 hours after online publication and is updated daily on week days.
Initial download of the metrics may take a while.