Free Access
Fig. 11
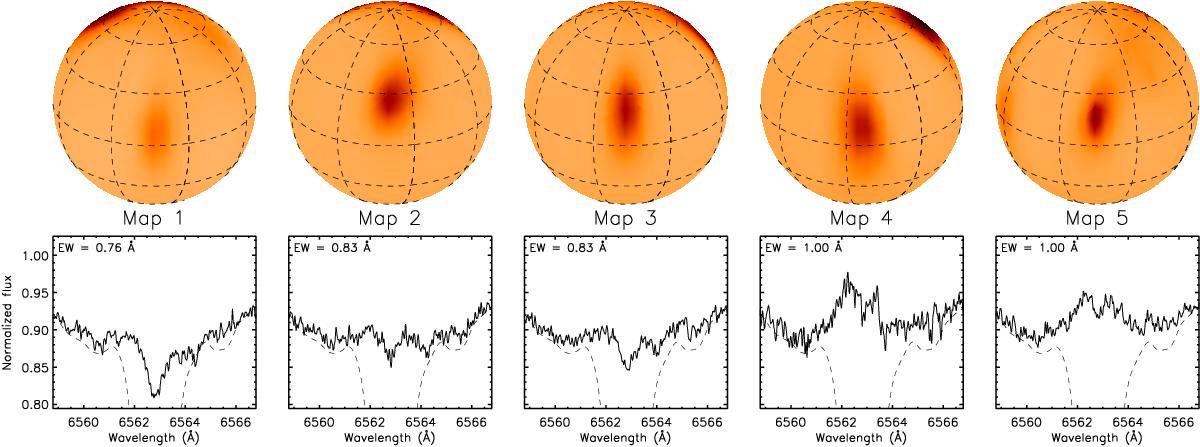
Orthographic projection of the five maps centered at the position of the spot S1 together with the average Hα line at that phase. The spectrum of the non-active reference star HD 3765 is shown as a dashed line. The color table is the same as in Fig. 5.
Current usage metrics show cumulative count of Article Views (full-text article views including HTML views, PDF and ePub downloads, according to the available data) and Abstracts Views on Vision4Press platform.
Data correspond to usage on the plateform after 2015. The current usage metrics is available 48-96 hours after online publication and is updated daily on week days.
Initial download of the metrics may take a while.