Free Access
Fig. 1
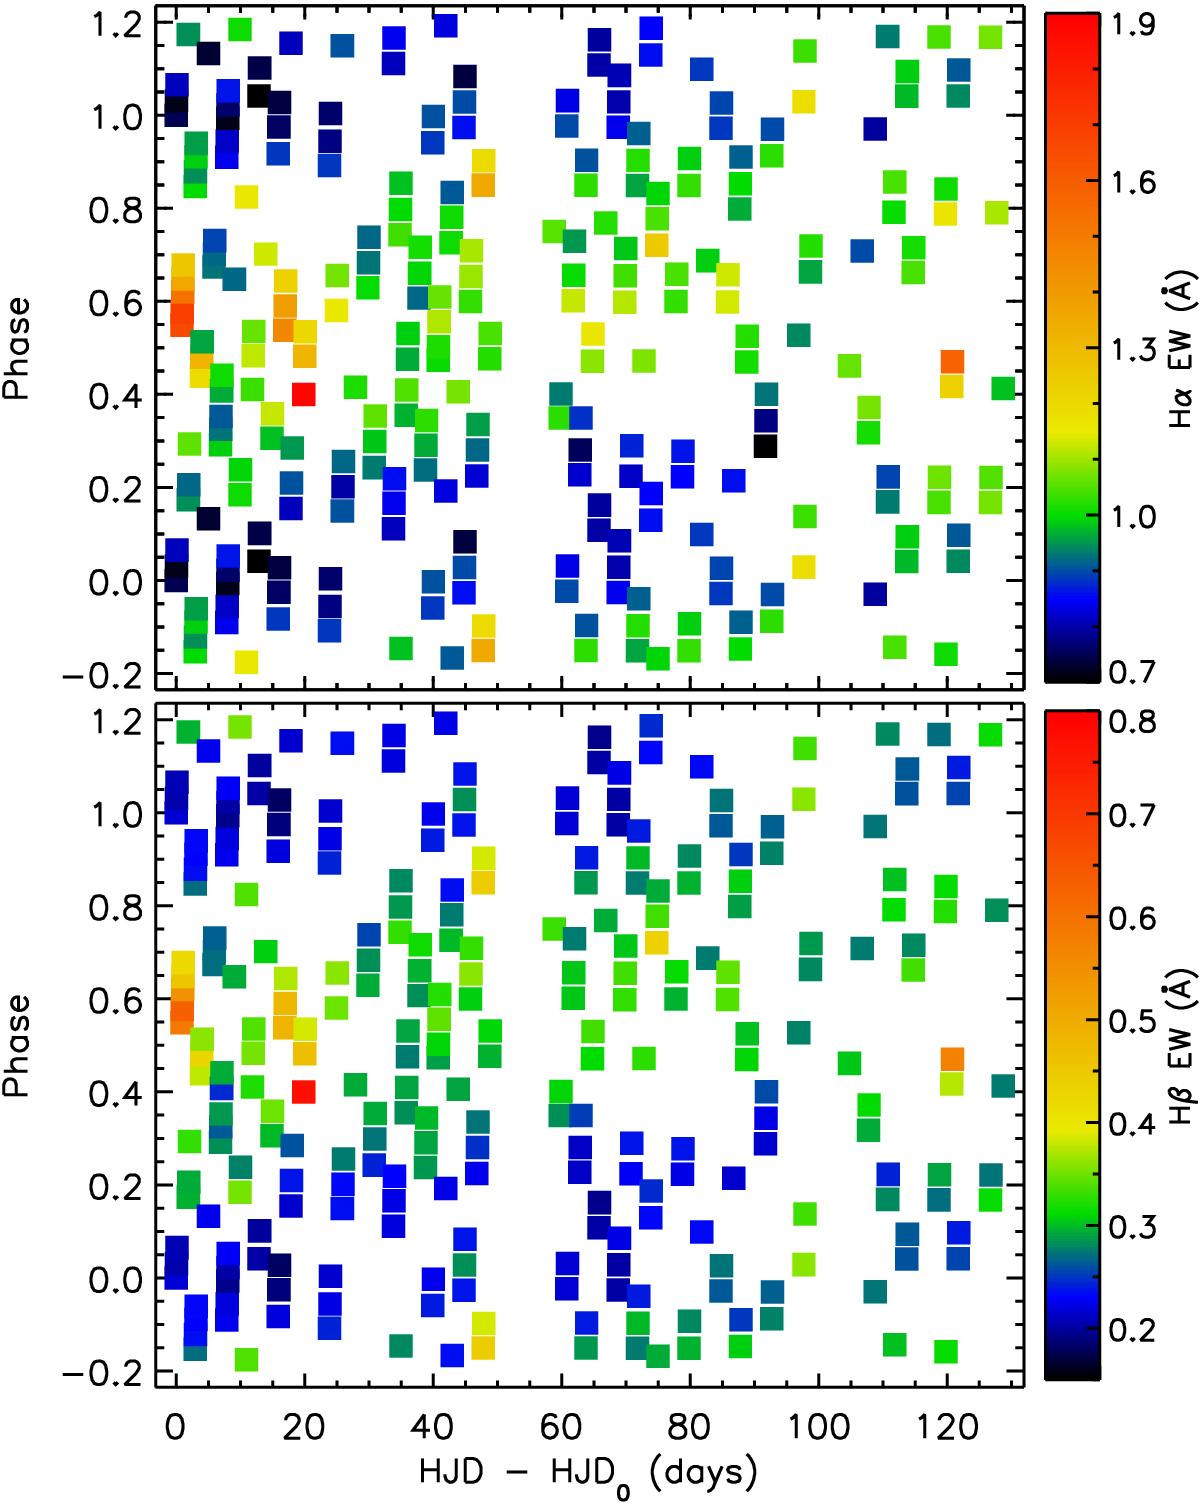
Temporal evolution of the equivalent width of the Hα and Hβ emission profiles (top and bottom panels, respectively) at different rotational phases. Blue-green points correspond to measurements of the basal emission. Orange-red values correspond to sporadic flares.
Current usage metrics show cumulative count of Article Views (full-text article views including HTML views, PDF and ePub downloads, according to the available data) and Abstracts Views on Vision4Press platform.
Data correspond to usage on the plateform after 2015. The current usage metrics is available 48-96 hours after online publication and is updated daily on week days.
Initial download of the metrics may take a while.