Free Access
Fig. A.2
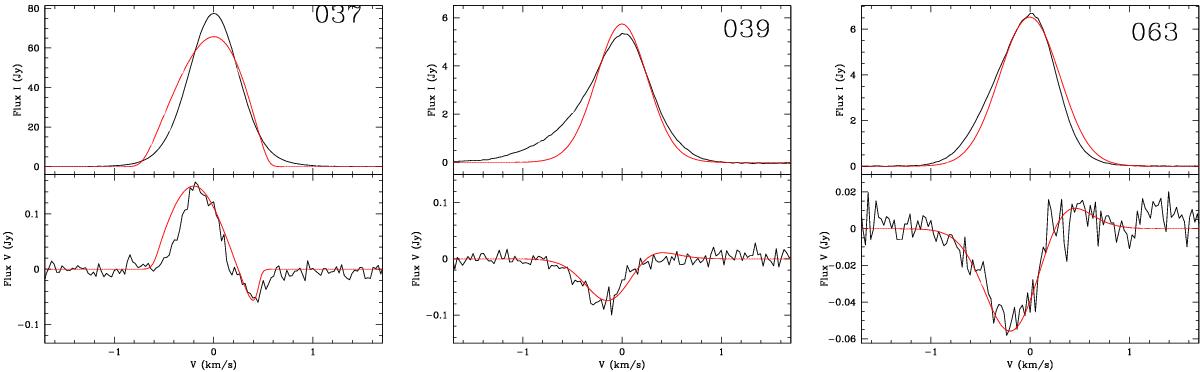
Total intensity (I, upper panel) and circular polarization intensity (V, lower panel) spectra for the H2O maser features 037, 039, 063. The thick red line shows the best-fit models of I and V emission obtained using the FRTM code (see Appendix A). The maser features are centered on zero velocity.
This figure is made of several images, please see below:
Current usage metrics show cumulative count of Article Views (full-text article views including HTML views, PDF and ePub downloads, according to the available data) and Abstracts Views on Vision4Press platform.
Data correspond to usage on the plateform after 2015. The current usage metrics is available 48-96 hours after online publication and is updated daily on week days.
Initial download of the metrics may take a while.