Fig. 2
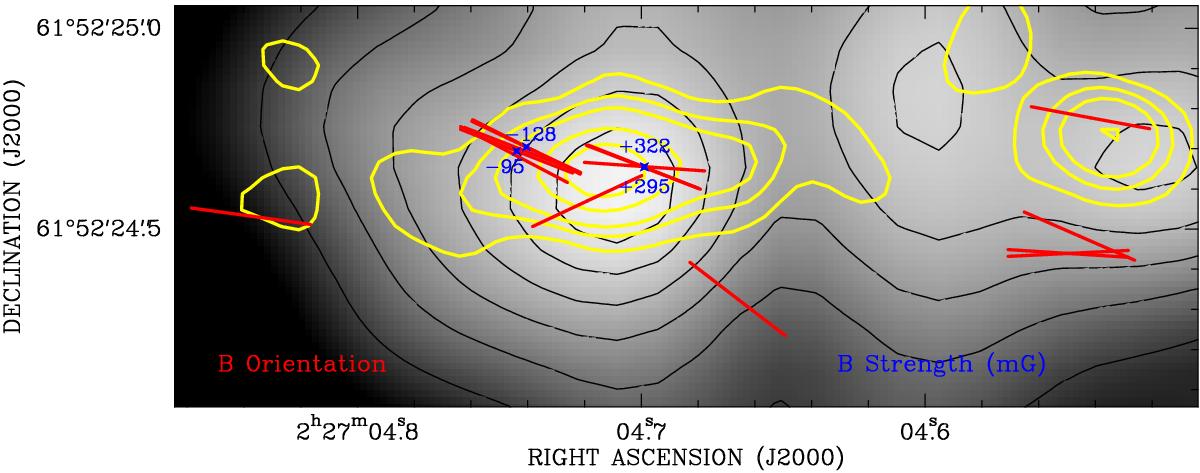
Magnetic field orientation (in the plane of the sky) for 17 individual masers with Pl< 5% (red segment) and strength for four (non-saturated) masers for which the Zeeman splitting was measured. The 8.4 GHz emission imaged with the VLA (beamsize ~ 0.′′2) by Wilner et al. (1999) (yellow contours: corresponding to 0.02, 0.06, 0.1, 0.2, 0.3 mJy beam-1) is overplotted onto the 1.4 mm continuum emission mapped with the PdBI (beamsize ~ 0.′′5) by Wyrowski et al. (1999) (gray scale and black contours: same as in Fig. 1). The radio continuum shows a main central component, the synchrotron jet, and two (western and eastern) secondary components (see Sect. 4.1 for an interpretation).
Current usage metrics show cumulative count of Article Views (full-text article views including HTML views, PDF and ePub downloads, according to the available data) and Abstracts Views on Vision4Press platform.
Data correspond to usage on the plateform after 2015. The current usage metrics is available 48-96 hours after online publication and is updated daily on week days.
Initial download of the metrics may take a while.