Fig. 1
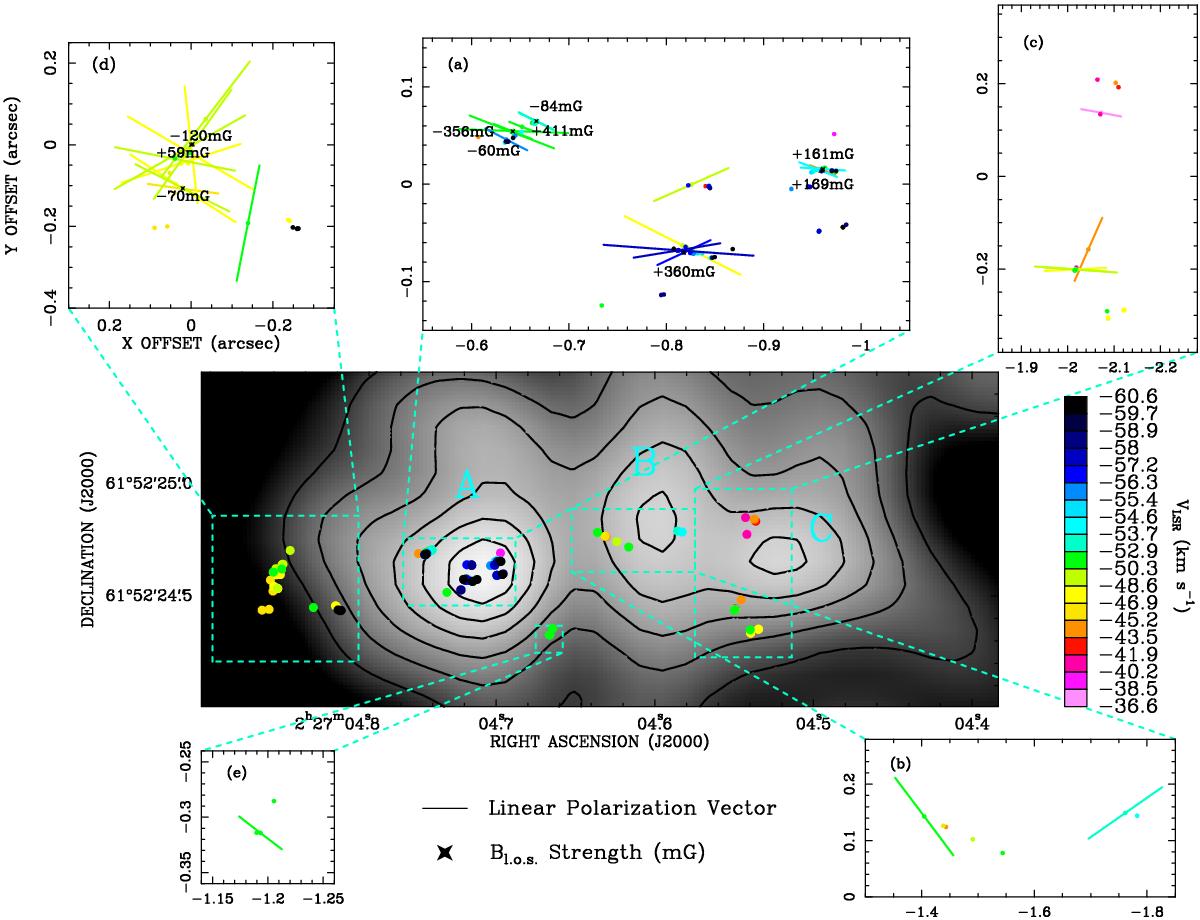
Overlay of the water masers detected with the VLBA in W3(H2O) onto the 1.4 mm continuum emission mapped with the PdBI by Wyrowski et al. (1999) (gray scale and black contours). The circles show positions of the H2O masers, while the colors denote their l.o.s. velocity in km s-1 (color scale on the right-hand side). The three 1.4 mm continuum peaks identified by Wyrowski et al. (1999) are labelled A, B, and C, from east to west. Contour levels correspond to steps of 24 mJy beam-1 (starting from 47 mJy beam-1). The insets show the linear polarization vectors of individual maser features in different clusters (from a to e), where the length of the line segments scales logarithmically with the polarization fraction (in the range Pl = 0.9−42%). We also report the magnetic field strengths (in mG) along the l.o.s. (Bl.o.s.) in the maser features for which we measured the Zeeman splitting. The positions are relative to the reference maser feature used for data self-calibration (ID 018 in Table D.1).
Current usage metrics show cumulative count of Article Views (full-text article views including HTML views, PDF and ePub downloads, according to the available data) and Abstracts Views on Vision4Press platform.
Data correspond to usage on the plateform after 2015. The current usage metrics is available 48-96 hours after online publication and is updated daily on week days.
Initial download of the metrics may take a while.