Fig. 1
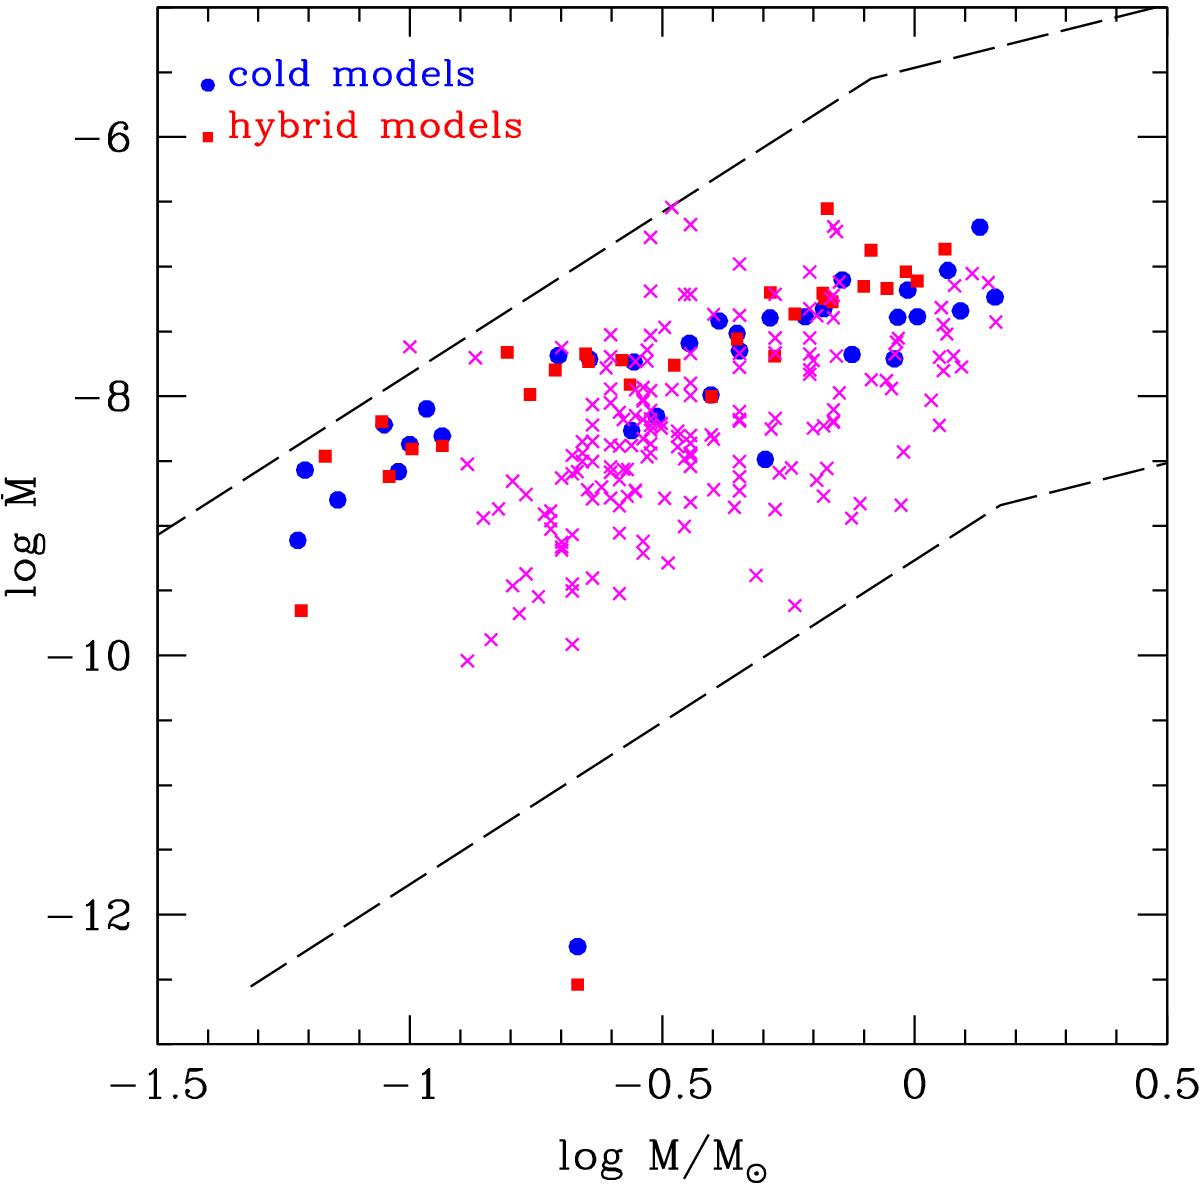
Relation between accretion rates derived from the hydrodynamical simulations (at an age of 1 Myr) and stellar mass for the cold (blue dots) and hybrid (magenta squares) cases. The magenta crosses are taken from the observations of Venuti et al. (2014). The dashed lines indicate the lower and upper limits observationally derived by Fang et al. (2013).
Current usage metrics show cumulative count of Article Views (full-text article views including HTML views, PDF and ePub downloads, according to the available data) and Abstracts Views on Vision4Press platform.
Data correspond to usage on the plateform after 2015. The current usage metrics is available 48-96 hours after online publication and is updated daily on week days.
Initial download of the metrics may take a while.