Fig. 9
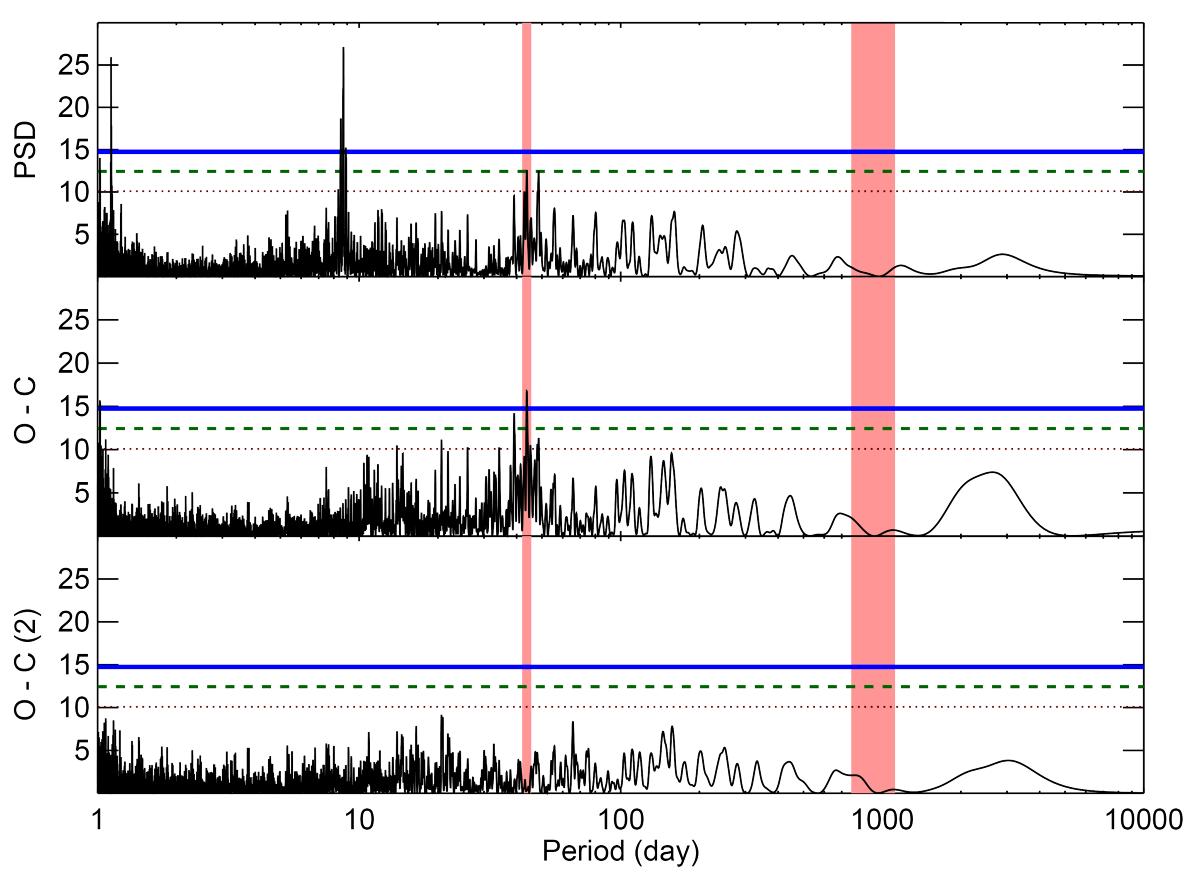
Periodograms of the radial velocity. The upper panel shows the raw periodogram, the middle panel the periodogram of the residuals after subtracting the 8.7 d signal, and the lower panel the periodogram of the residuals after subtracting the 43 d signal present in the middle panel. Red regions show the periods of the measured rotation and magnetic cycle. Red dotted line for a 10% false alarm probability; green dashed line for 1%, and blue thick line for 0.1%.
Current usage metrics show cumulative count of Article Views (full-text article views including HTML views, PDF and ePub downloads, according to the available data) and Abstracts Views on Vision4Press platform.
Data correspond to usage on the plateform after 2015. The current usage metrics is available 48-96 hours after online publication and is updated daily on week days.
Initial download of the metrics may take a while.