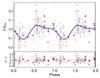
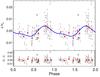
Fig. 6

Phase folded fit for the isolated long period activity signal using double-harmonic sine curves. The left panel shows the SMW index data using the 824 d signal, while the right panel shows the Hα signal using the 1075 d signal. Grey dots are the raw measurements after subtracting the mean value. Red dots are the same points binned in phase with a bin size of 0.1.
Current usage metrics show cumulative count of Article Views (full-text article views including HTML views, PDF and ePub downloads, according to the available data) and Abstracts Views on Vision4Press platform.
Data correspond to usage on the plateform after 2015. The current usage metrics is available 48-96 hours after online publication and is updated daily on week days.
Initial download of the metrics may take a while.