Fig. 6
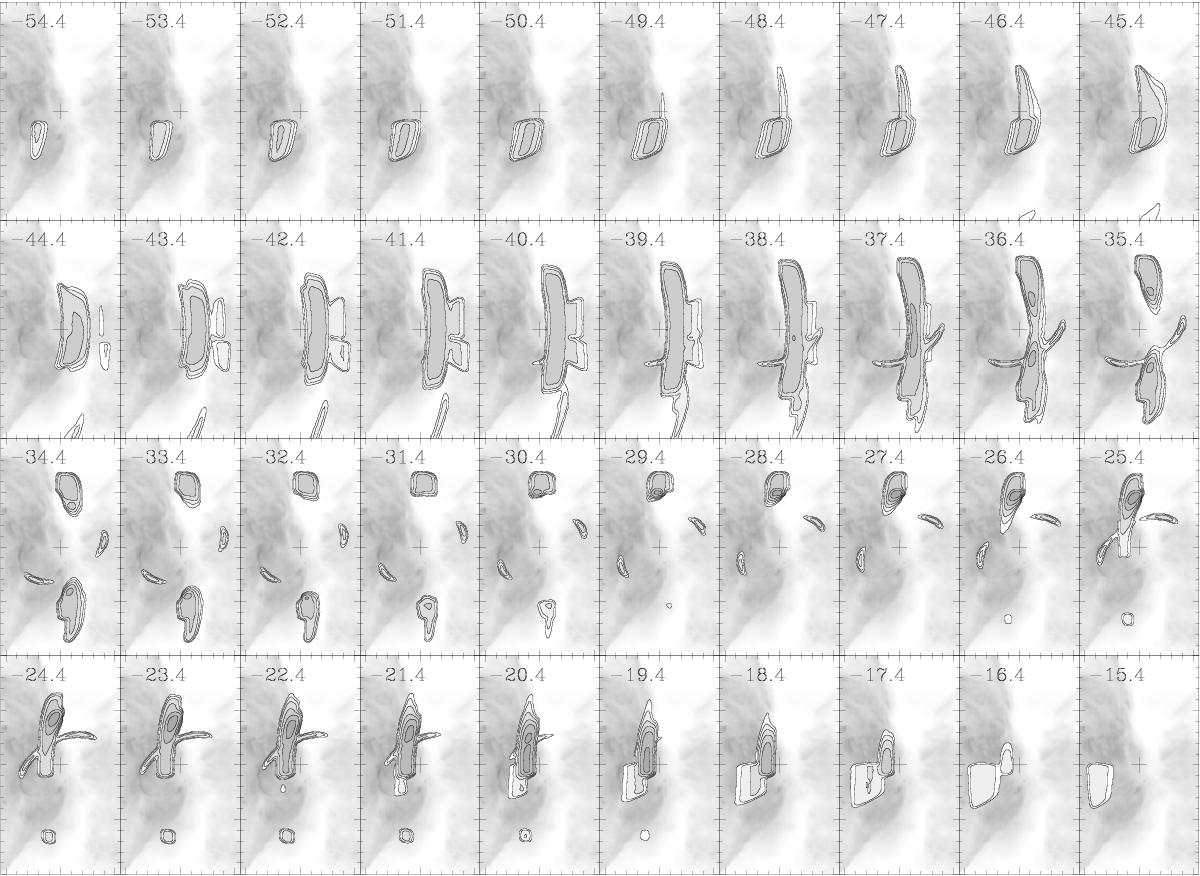
ALMA 12CO J = 3−2 model of the molecular region of NGC 6302. The field of view is 11′′ × 20′′. VLSR velocities in km s-1 are indicated in each channel. The intensity scale of the contours is logarithmic, with first contour at 40 mJy beam-1, and a step of 3 dB (i.e. a factor of 100.3 ≃ 2) between adjacent contours. The differences in thickness and intensity of the model when compared to the observations mainly arise from the considerable flux loss affecting the ALMA observations (see text), which are particularly noticeable near the systemic velocities. Also, the logarithmic scale gives a false, too pessimistic impression of the brightness overestimate of the synthetic maps, which mainly affects the first, very low contours. An HST F673N image of the central region of NGC 6302 is shown in the background for comparison purposes.
Current usage metrics show cumulative count of Article Views (full-text article views including HTML views, PDF and ePub downloads, according to the available data) and Abstracts Views on Vision4Press platform.
Data correspond to usage on the plateform after 2015. The current usage metrics is available 48-96 hours after online publication and is updated daily on week days.
Initial download of the metrics may take a while.