Fig. 5
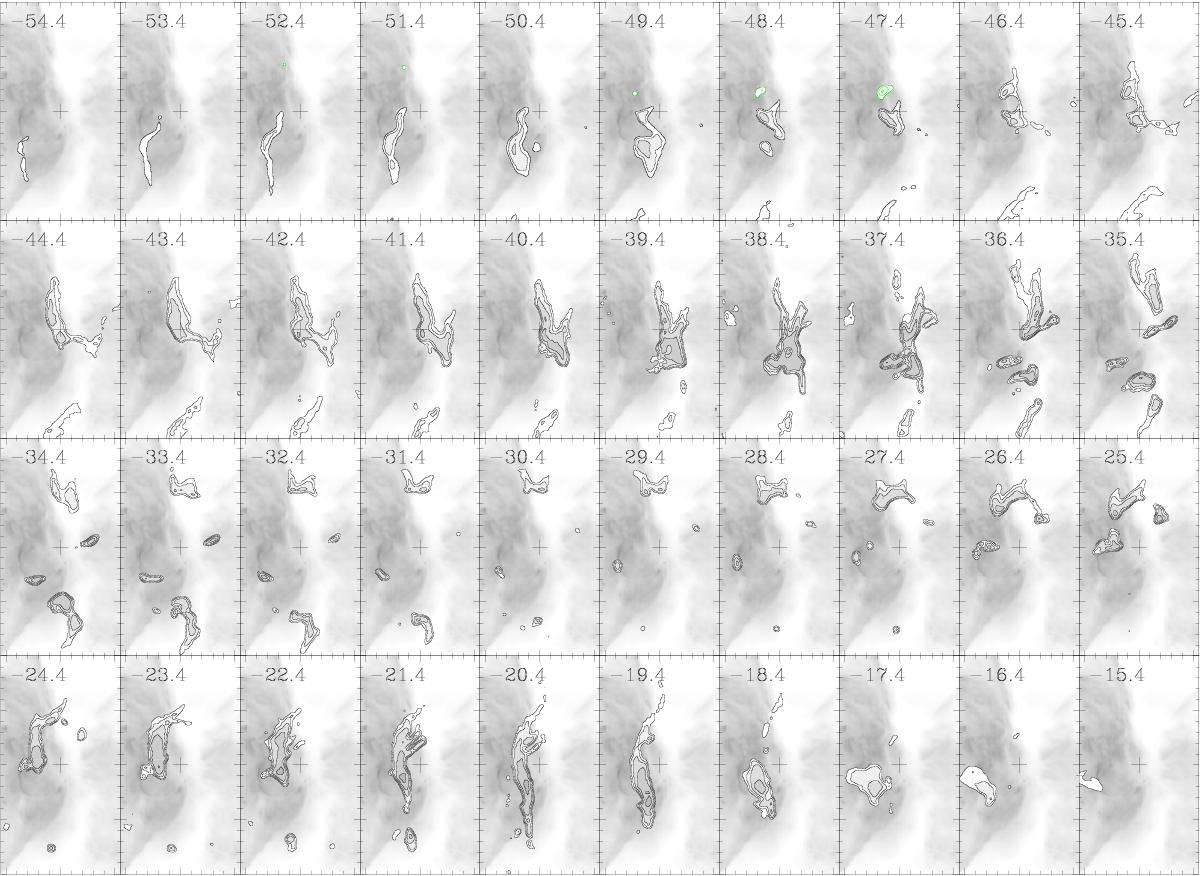
ALMA 12CO J = 3−2 emission map of NGC 6302, binned to 1 km s-1. The field of view is 11′′ × 20′′. VLSR velocities in km s-1 are indicated in each channel. The intensity scale of the contours is logarithmic with the first contour at 40 mJy beam-1, and a step of 3 dB (i.e. a factor of 100.3 ≃ 2) between adjacent contours. The deepest negative contour has a level of −100 mJy beam-1. Contamination by NS emission (see Appendix A) is highlighted in green wherever it can be spatially resolved from 12CO emission. An HST F673N image of the central region of NGC 6302 is shown in the background for comparison purposes.
Current usage metrics show cumulative count of Article Views (full-text article views including HTML views, PDF and ePub downloads, according to the available data) and Abstracts Views on Vision4Press platform.
Data correspond to usage on the plateform after 2015. The current usage metrics is available 48-96 hours after online publication and is updated daily on week days.
Initial download of the metrics may take a while.