Fig. 3
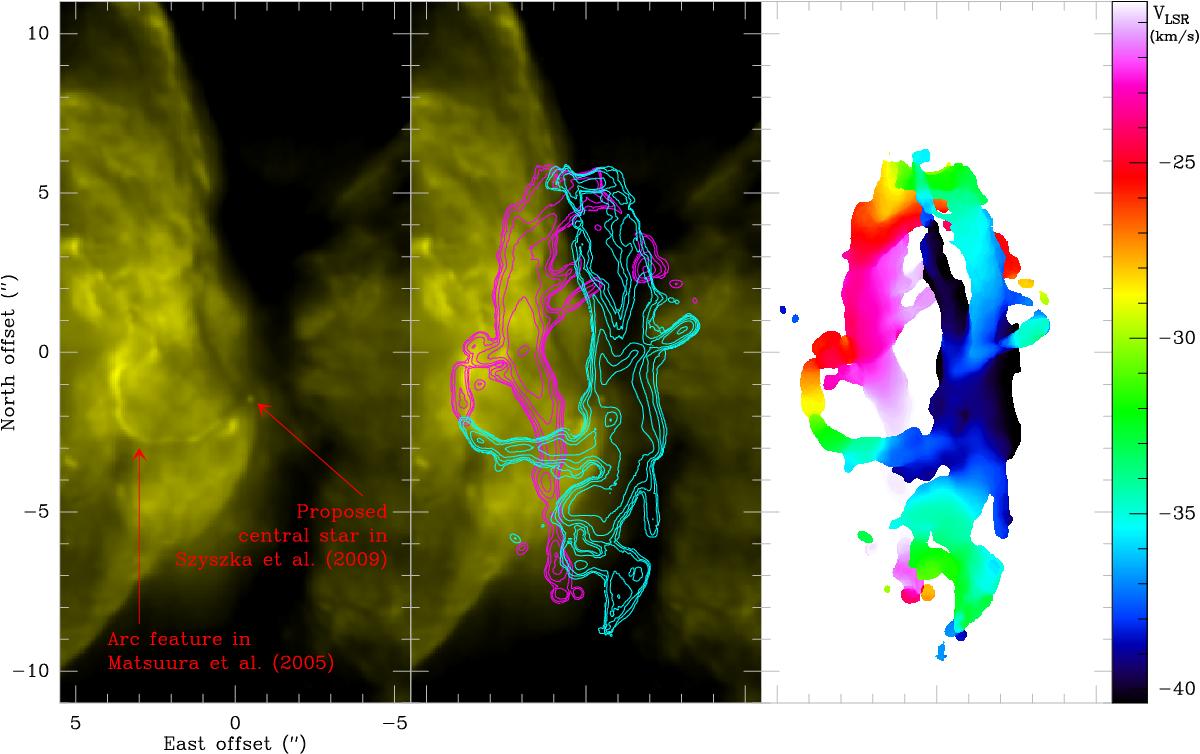
Left panel: HST/WFPC2 F673N image of the central region of NGC 6302. The intensity levels have been chosen to highlight the filament (or “arc”, as depicted by Matsuura et al. 2005), which seems to be the ionised inner rim of the inner ring reported in this work. Middle panel: integrated 12CO J = 3−2 emission in the 20 km s-1 around the systemic velocity of NGC 6302, with a threshold of 0.1 Jy beam-1. Cyan contours correspond to the emission from VLSR−40.4 to −30.4 km s-1 and magenta contours to the emission from −30.4 to −20.4 km s-1. The first contour corresponds to a level of 1 Jy km s-1, with a multiplicative step of ![]() between adjacent contours. Both rings are apparent in the figure, the main ring running almost vertically, the other inclined, and its major axis running almost along the northwest to southeast direction. Some contours inside the main ring denote a brightness decrease towards holes with no emission (shown in white in the right panel). Right panel: intensity-weighted mean radial velocities in the same intervals as in the middle panel, revealing an expanding kinematics for both structures. The colour-velocity correspondence is shown to the right of the panel. The systemic velocity is VLSR = −30.4 km s-1.
between adjacent contours. Both rings are apparent in the figure, the main ring running almost vertically, the other inclined, and its major axis running almost along the northwest to southeast direction. Some contours inside the main ring denote a brightness decrease towards holes with no emission (shown in white in the right panel). Right panel: intensity-weighted mean radial velocities in the same intervals as in the middle panel, revealing an expanding kinematics for both structures. The colour-velocity correspondence is shown to the right of the panel. The systemic velocity is VLSR = −30.4 km s-1.
Current usage metrics show cumulative count of Article Views (full-text article views including HTML views, PDF and ePub downloads, according to the available data) and Abstracts Views on Vision4Press platform.
Data correspond to usage on the plateform after 2015. The current usage metrics is available 48-96 hours after online publication and is updated daily on week days.
Initial download of the metrics may take a while.