Fig. A.1
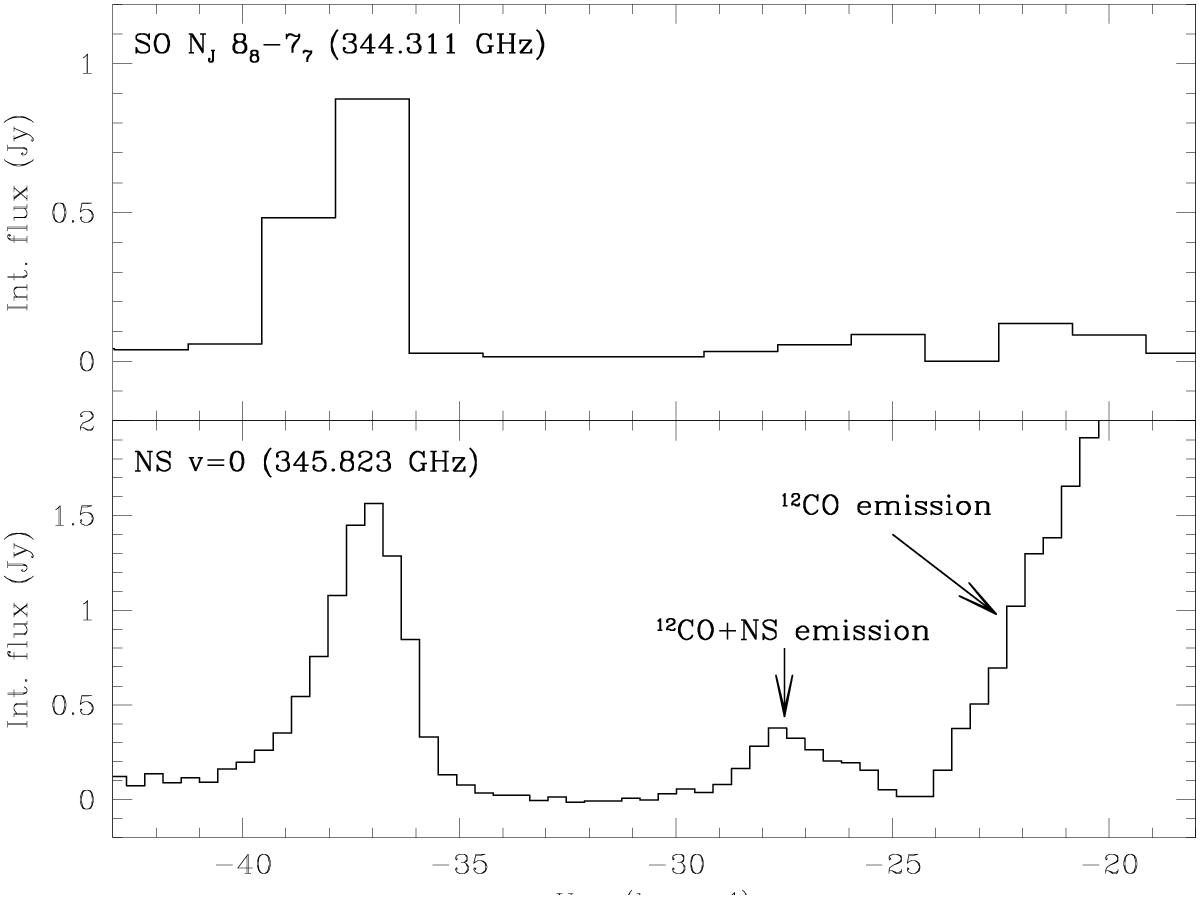
Top panel: continuum-subtracted, spatially-integrated emission from the NJ, 88−77 line of SO (344.311 GHz). Bottom panel: continuum-subtracted, spatially-integrated emission from NS (345.823 GHz). The emission from NS partially overlaps with that from 12CO J = 3−2 (in Fig. 1, the emission around VLSR = −62 km s-1 corresponds to NS).
Current usage metrics show cumulative count of Article Views (full-text article views including HTML views, PDF and ePub downloads, according to the available data) and Abstracts Views on Vision4Press platform.
Data correspond to usage on the plateform after 2015. The current usage metrics is available 48-96 hours after online publication and is updated daily on week days.
Initial download of the metrics may take a while.