Fig. 8
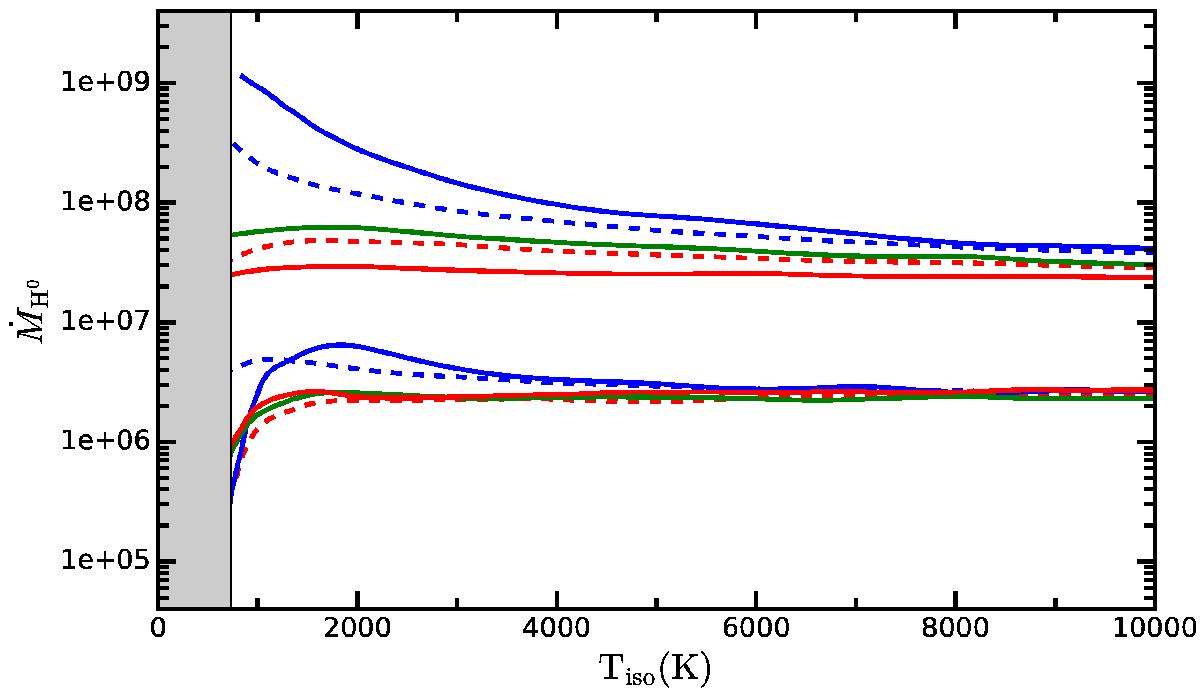
Upper limit on the neutral hydrogen escape rate as a function of the mean temperature in the HD 97658 b isotropic atmosphere. Lines in the lower part of the plot correspond to the 1σ confidence level, lines in the upper part to the 3σ level. Solid lines correspond to Rtrans = 4 Rpl and outflow bulk velocities vtrans = 1 km s-1 (blue), 10 km s-1 (green), and 20 km s-1 (red). Dashed lines correspond to vtrans = 10 km s-1 and transitions between the isotropic atmosphere and the exosphere Rtrans = 2 Rpl (blue), 4 Rpl (green), and 6 Rpl (red). The temperature is limited to the equilibrium temperature of the planet (Teq ~ 725 K, Knutson et al. 2014).
Current usage metrics show cumulative count of Article Views (full-text article views including HTML views, PDF and ePub downloads, according to the available data) and Abstracts Views on Vision4Press platform.
Data correspond to usage on the plateform after 2015. The current usage metrics is available 48-96 hours after online publication and is updated daily on week days.
Initial download of the metrics may take a while.