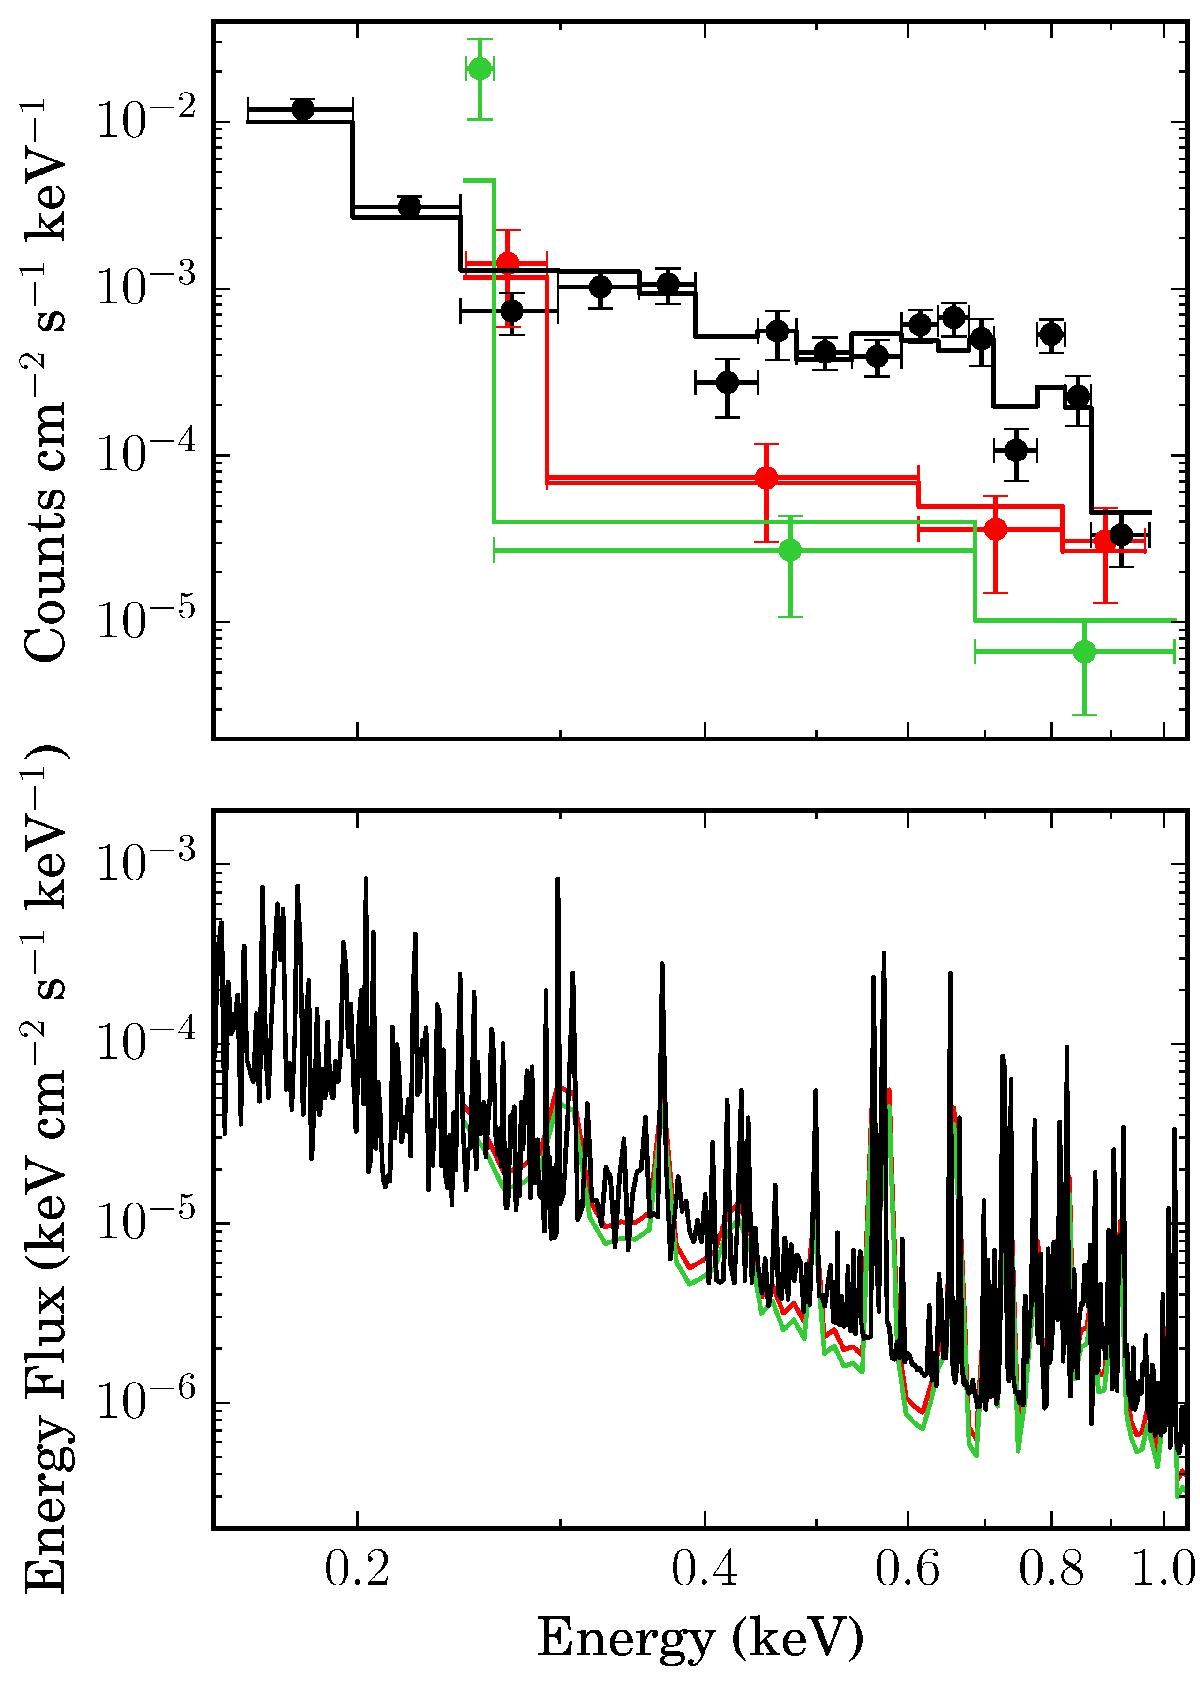
Fig. 7

X-ray spectrum of HD 97658. The upper panel shows the spectra in units of measured counts, with XMM-Newton EPIC-PN in June 2015 (black points), and with Chandra in December 2015 (red points) and March 2016 (green points). To account for the different sensitivity of Chandra and EPIC-PN, the count rates are divided by the effective area of each instrument in the energy range covered by each bin. While this approach allows for a better comparison, it is an approximation that does not account for the redistribution matrix. The histogram spectra correspond to the best fits obtained with the CEMEKL model, which are plotted in flux units and displayed at high spectral resolution in the lower panel.
Current usage metrics show cumulative count of Article Views (full-text article views including HTML views, PDF and ePub downloads, according to the available data) and Abstracts Views on Vision4Press platform.
Data correspond to usage on the plateform after 2015. The current usage metrics is available 48-96 hours after online publication and is updated daily on week days.
Initial download of the metrics may take a while.


