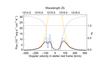
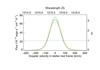
Fig. 6
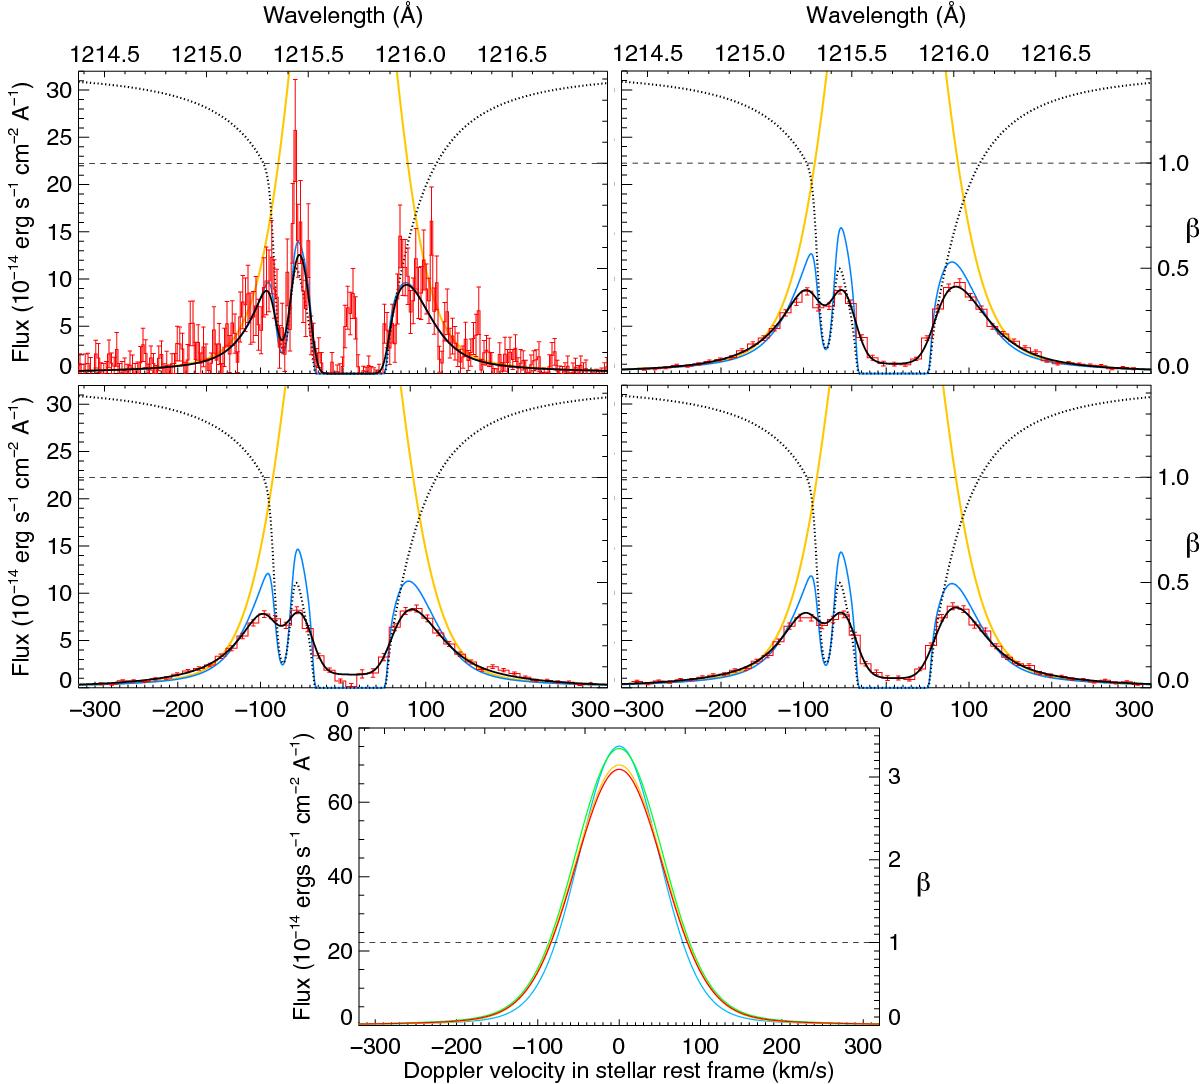
Lyman-α line profiles of HD 97658 for Visits 0 (top left), 1 (top right), 2 (middle left), and 3 (middle right). The yellow line shows the theoretical intrinsic stellar emission line profile as seen by the planet upper atmosphere, scaled to the Earth distance. It also corresponds to the profile of the ratio β between radiation pressure and stellar gravity (values reported on the right axis). The solid blue line shows the Lyman-α line profile after absorption by the interstellar hydrogen (1215.6 Å) and deuterium (1215.25 Å), whose cumulated profile is plotted as a dotted black line (ISM absorption in the range 0−1 has been scaled to the vertical axis range). The solid black line shows the line profile convolved with the high-resolution E140M LSF in Visit 0 and with the lower resolution G140M LSF in the other visits. It is compared to the observations shown as a red histogram. Note the residual airglow in the core of Visit 0 spectrum. Intrinsic profiles reconstructed for all visits can be compared in the bottom panel (Visit 0 in blue; Visit 1 in green; Visit 2 in yellow; Visit 3 in red).

Current usage metrics show cumulative count of Article Views (full-text article views including HTML views, PDF and ePub downloads, according to the available data) and Abstracts Views on Vision4Press platform.
Data correspond to usage on the plateform after 2015. The current usage metrics is available 48-96 hours after online publication and is updated daily on week days.
Initial download of the metrics may take a while.