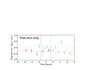
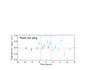
Fig. 5
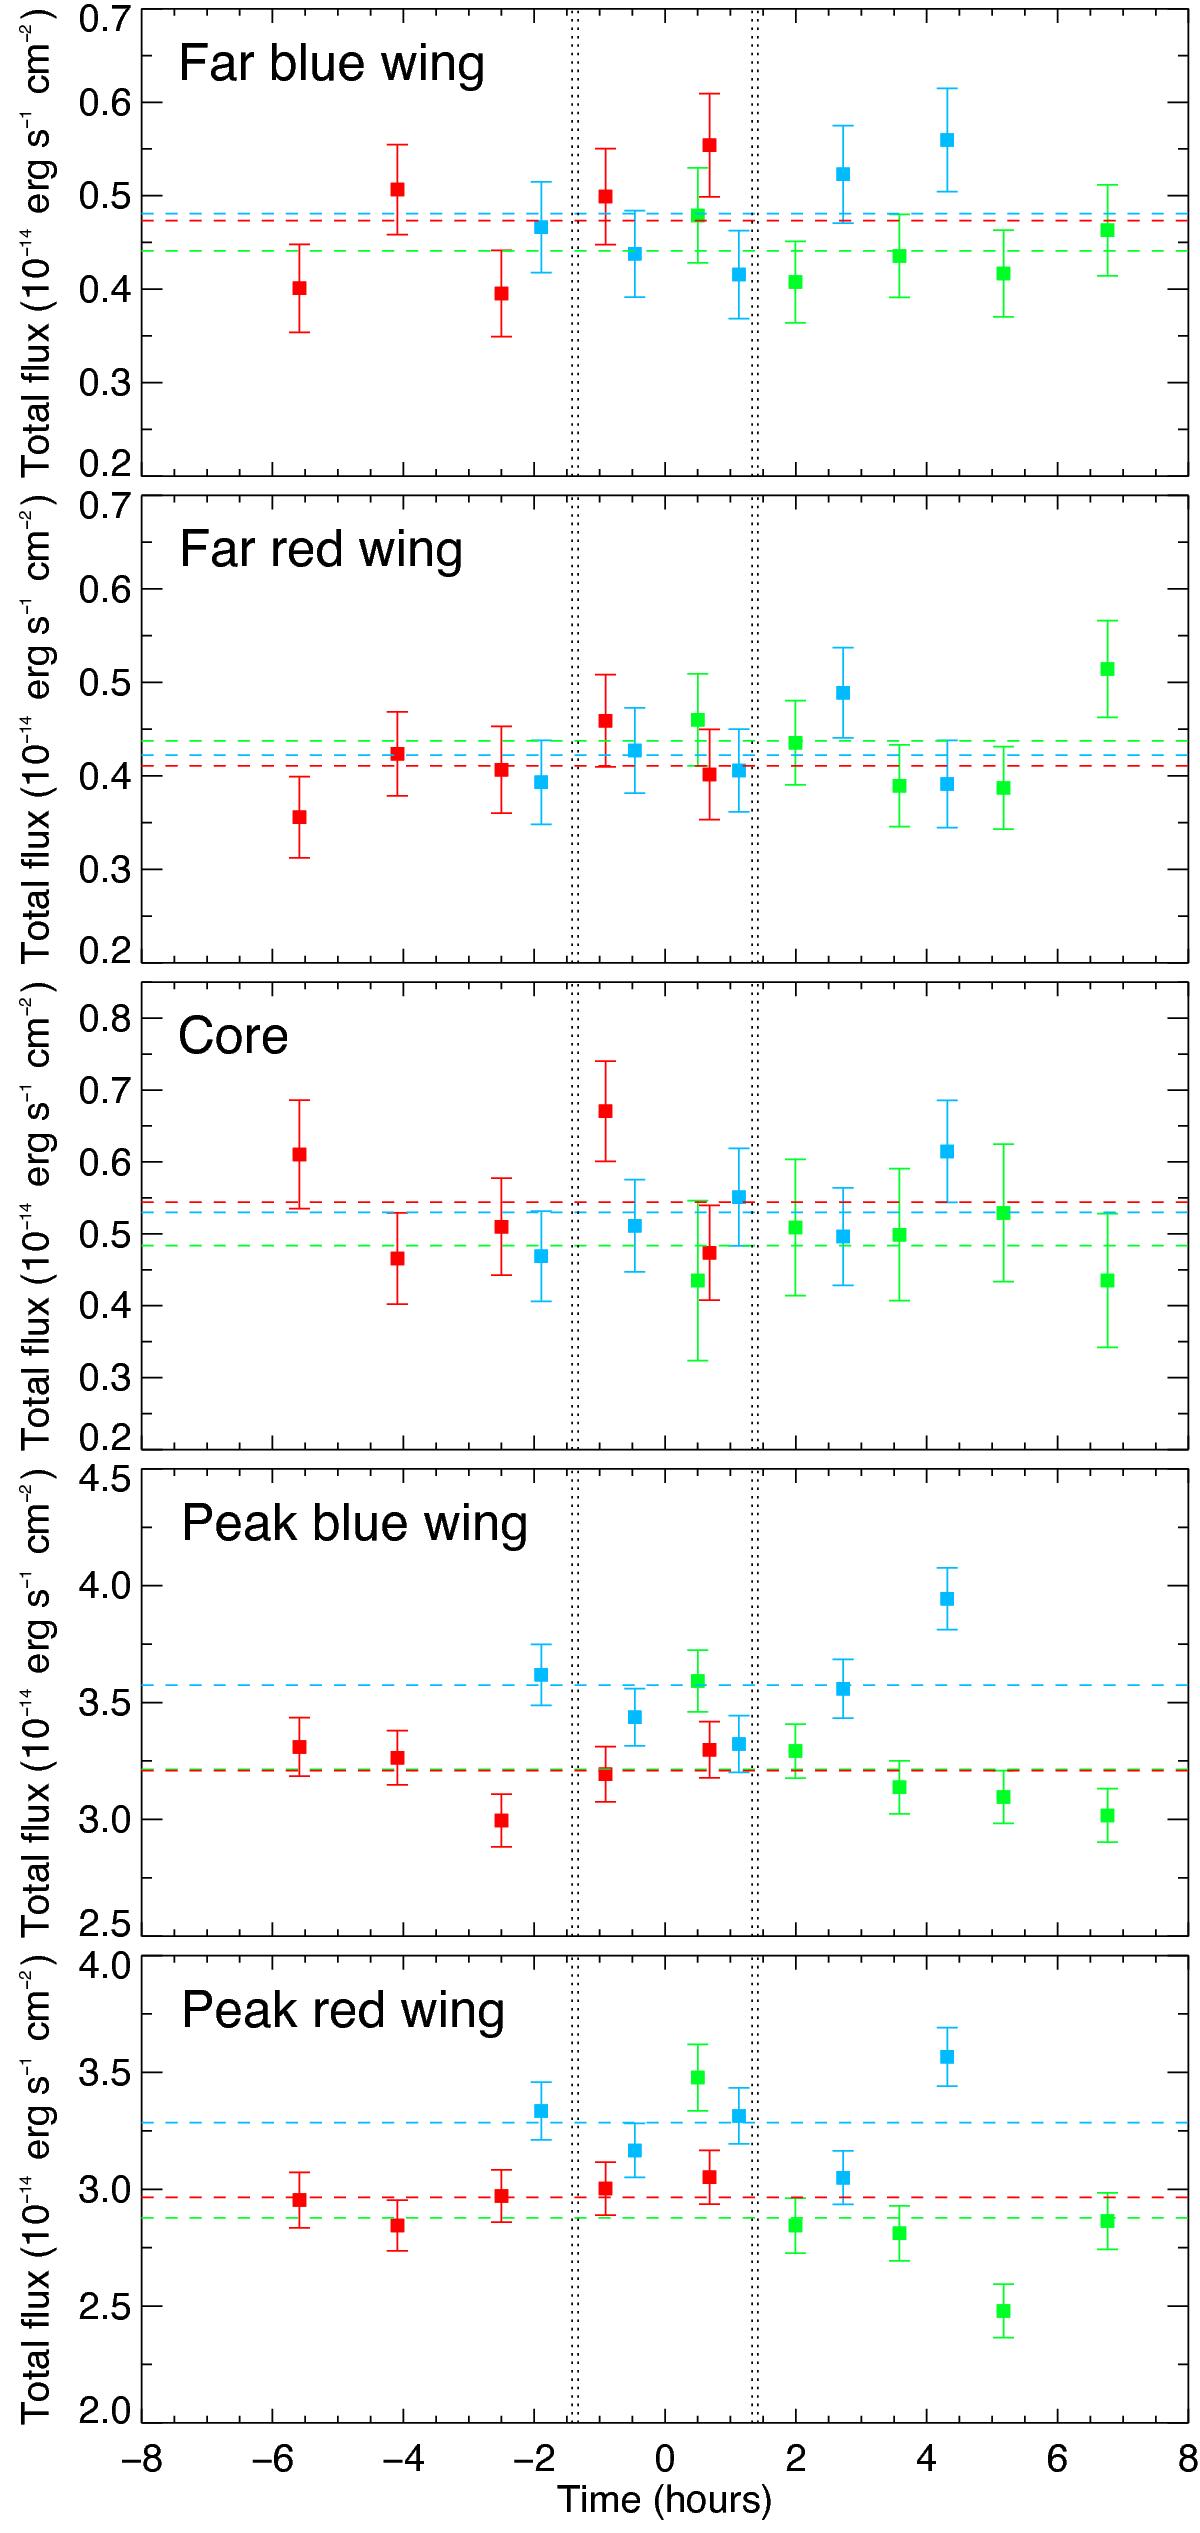
Comparison of the Lyman-α flux between Visits 1 (blue), 2 (green), and 3 (red), integrated in complementary bands. All spectra have been interpolated over a common wavelength table before being summed, from top to bottom, in [−300; −183] km s-1, [183; 300] km s-1, [−33; 33] km s-1, [−183; −39] km s-1, and [39; 183] km s-1. Squares correspond to the spectra measured during each HST orbit, and dashed lines to the reference spectra.
Current usage metrics show cumulative count of Article Views (full-text article views including HTML views, PDF and ePub downloads, according to the available data) and Abstracts Views on Vision4Press platform.
Data correspond to usage on the plateform after 2015. The current usage metrics is available 48-96 hours after online publication and is updated daily on week days.
Initial download of the metrics may take a while.