Fig. 4
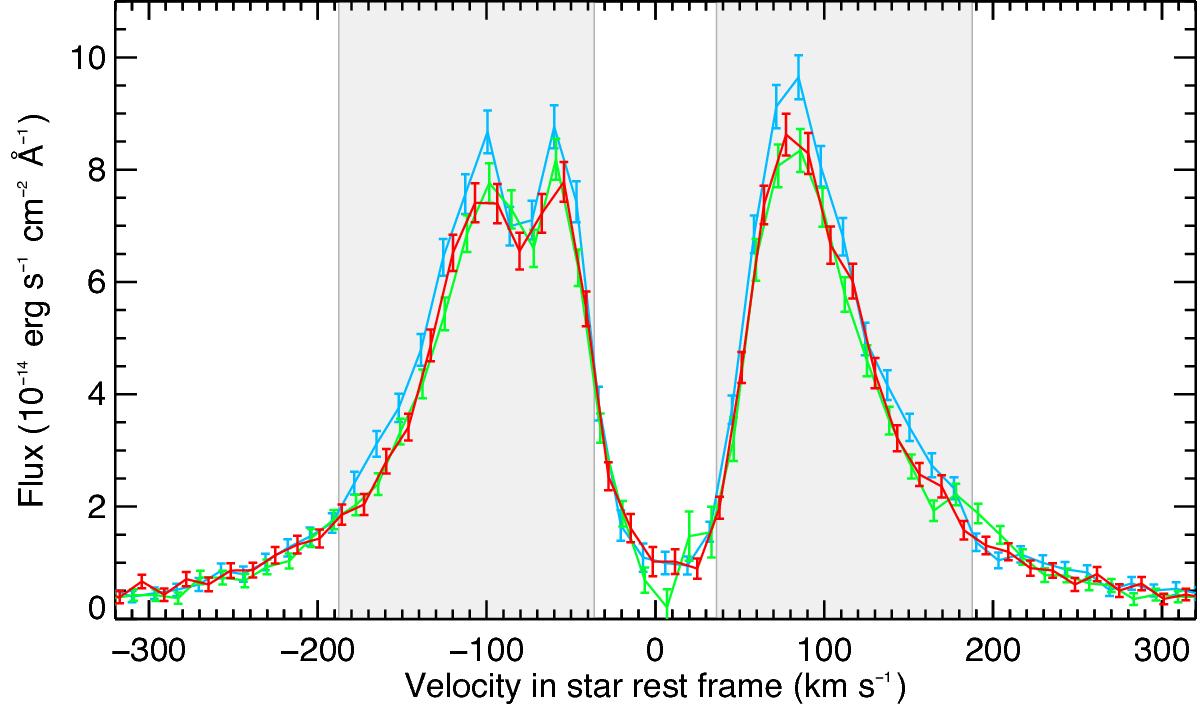
Comparison between the reference spectra in Visits 1 (blue), 2 (green), and 3 (red). The spectra for Visits 2 and 3 display no significant differences except for a localized feature around 200 km s-1. They are also similar to the core and the far wings of the Visit 1 reference spectrum, which shows however a 11 ± 2.7% flux increase in the shaded gray regions.
Current usage metrics show cumulative count of Article Views (full-text article views including HTML views, PDF and ePub downloads, according to the available data) and Abstracts Views on Vision4Press platform.
Data correspond to usage on the plateform after 2015. The current usage metrics is available 48-96 hours after online publication and is updated daily on week days.
Initial download of the metrics may take a while.