Fig. 3
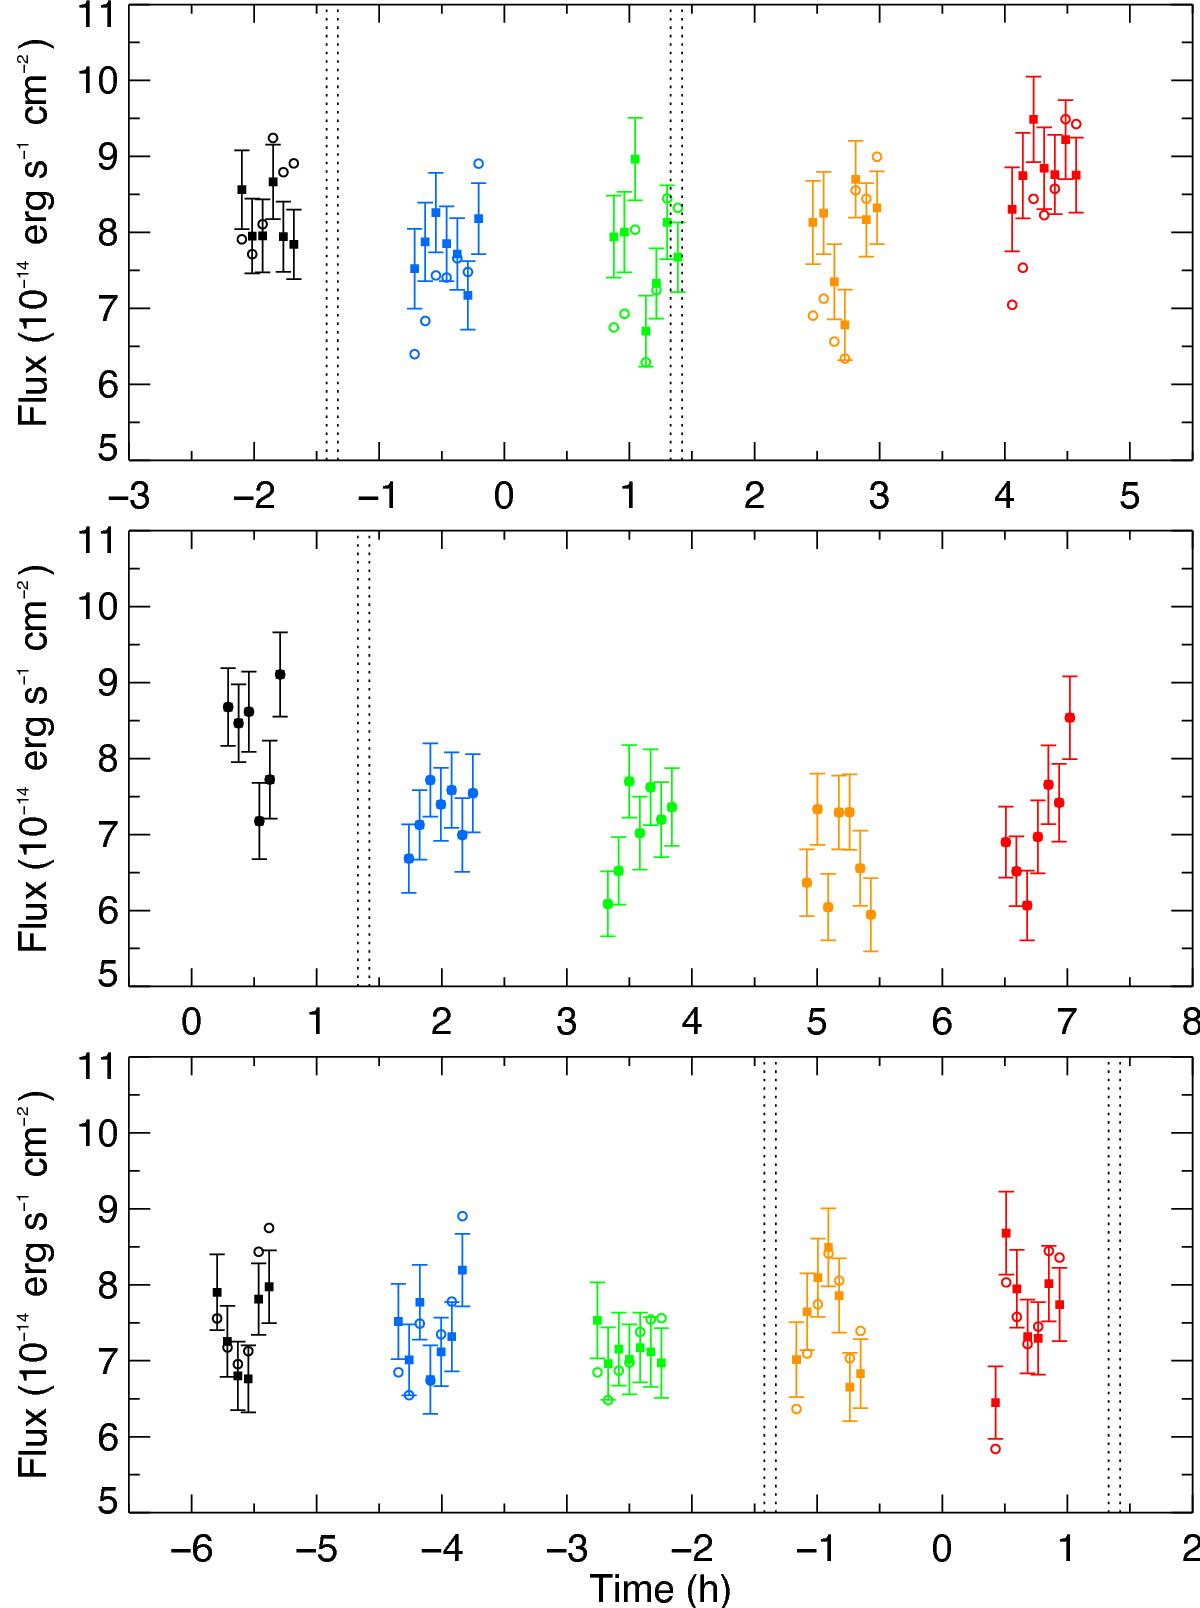
Raw fluxes uncorrected for the breathing effect (empty disks), as a function of time, relative to the center of the planetary transit. After correction by the fbreath function in Visits 1 and 3 (filled squares), the fluxes within a given orbit are, on average, equal to the best-fit value obtained for Fnom in this orbit. Each point stands for a 300 s exposure spectrum summed over the whole Lyman-α line. Vertical dotted lines show the beginning and end of ingress and egress of the transit. The color code is the same as in Fig. 1, and Visits 1, 2, and 3 are displayed from top to bottom.
Current usage metrics show cumulative count of Article Views (full-text article views including HTML views, PDF and ePub downloads, according to the available data) and Abstracts Views on Vision4Press platform.
Data correspond to usage on the plateform after 2015. The current usage metrics is available 48-96 hours after online publication and is updated daily on week days.
Initial download of the metrics may take a while.