Fig. 2
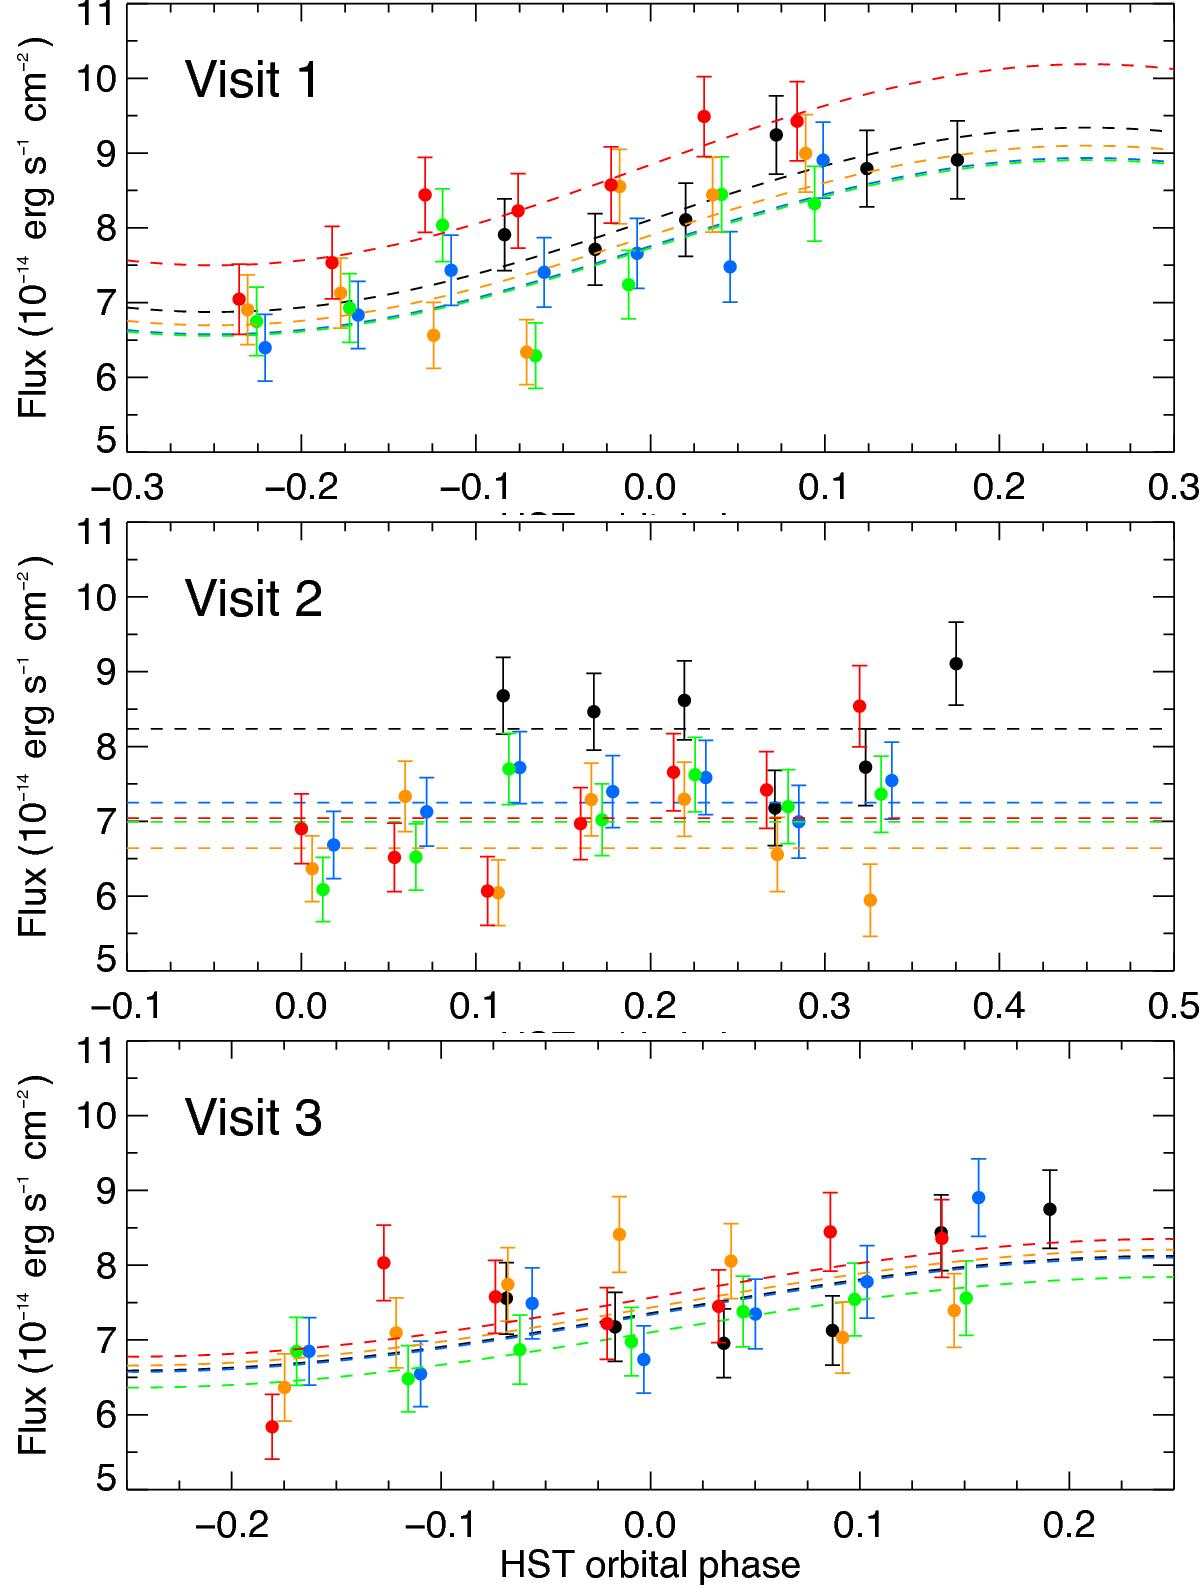
Lyman-α fluxes for 300 s exposures integrated over the entire line and phase-folded on the HST orbital period. The dashed lines correspond to the best fit for the Fcorr function. Since the contribution of the breathing effect fbreath to this fit is the same at a given HST phase, the best estimation for the intrinsic stellar flux in each orbit Fnom can be read at phase = 0 (see Eq. (1)). The color code is the same as in Fig. 1, and Visits 1, 2, and 3 are displayed from top to bottom.
Current usage metrics show cumulative count of Article Views (full-text article views including HTML views, PDF and ePub downloads, according to the available data) and Abstracts Views on Vision4Press platform.
Data correspond to usage on the plateform after 2015. The current usage metrics is available 48-96 hours after online publication and is updated daily on week days.
Initial download of the metrics may take a while.