Fig. 1
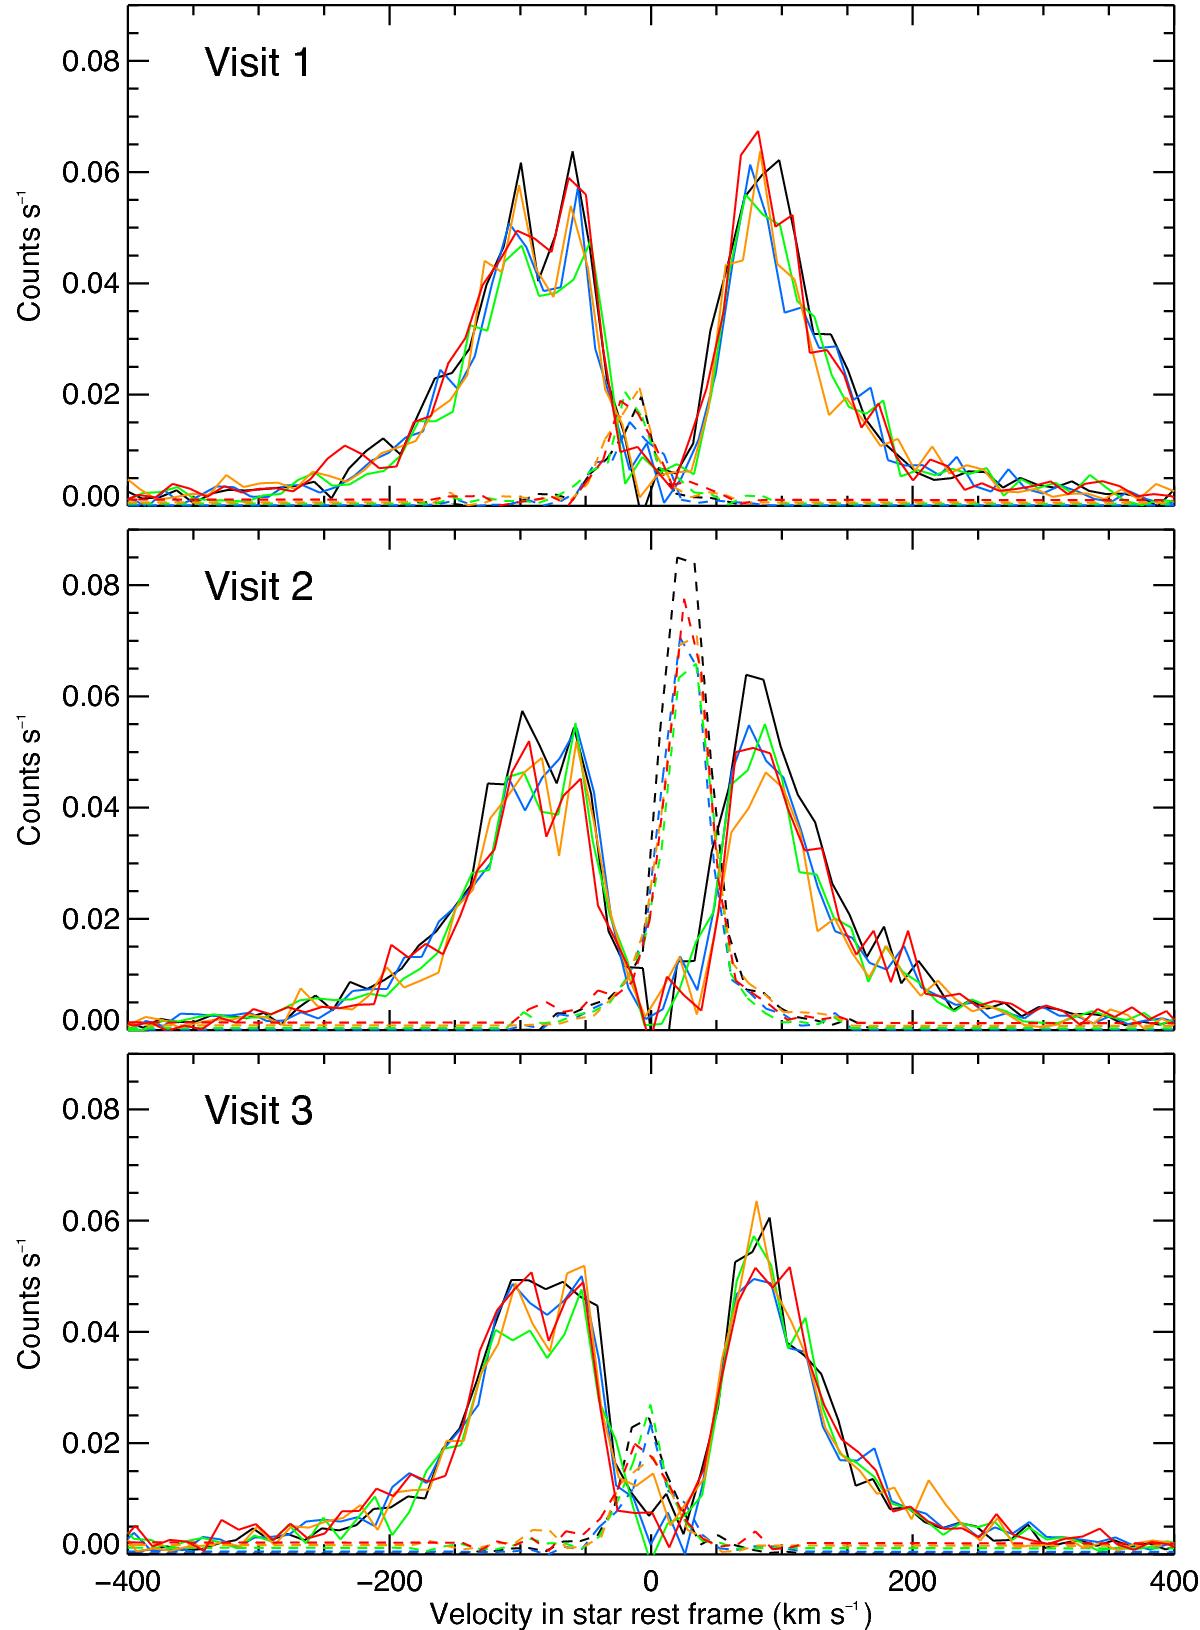
Raw spectra of the stellar Lyman-α line (solid line) after correction from the geocoronal emission line (superimposed as a dashed line). Visits 1, 2, and 3 are displayed from top to bottom, and in each panel the colors correspond to the HST orbit at consecutive orbital phases (increasing from black, blue, green, orange, red).
Current usage metrics show cumulative count of Article Views (full-text article views including HTML views, PDF and ePub downloads, according to the available data) and Abstracts Views on Vision4Press platform.
Data correspond to usage on the plateform after 2015. The current usage metrics is available 48-96 hours after online publication and is updated daily on week days.
Initial download of the metrics may take a while.