Fig. 4
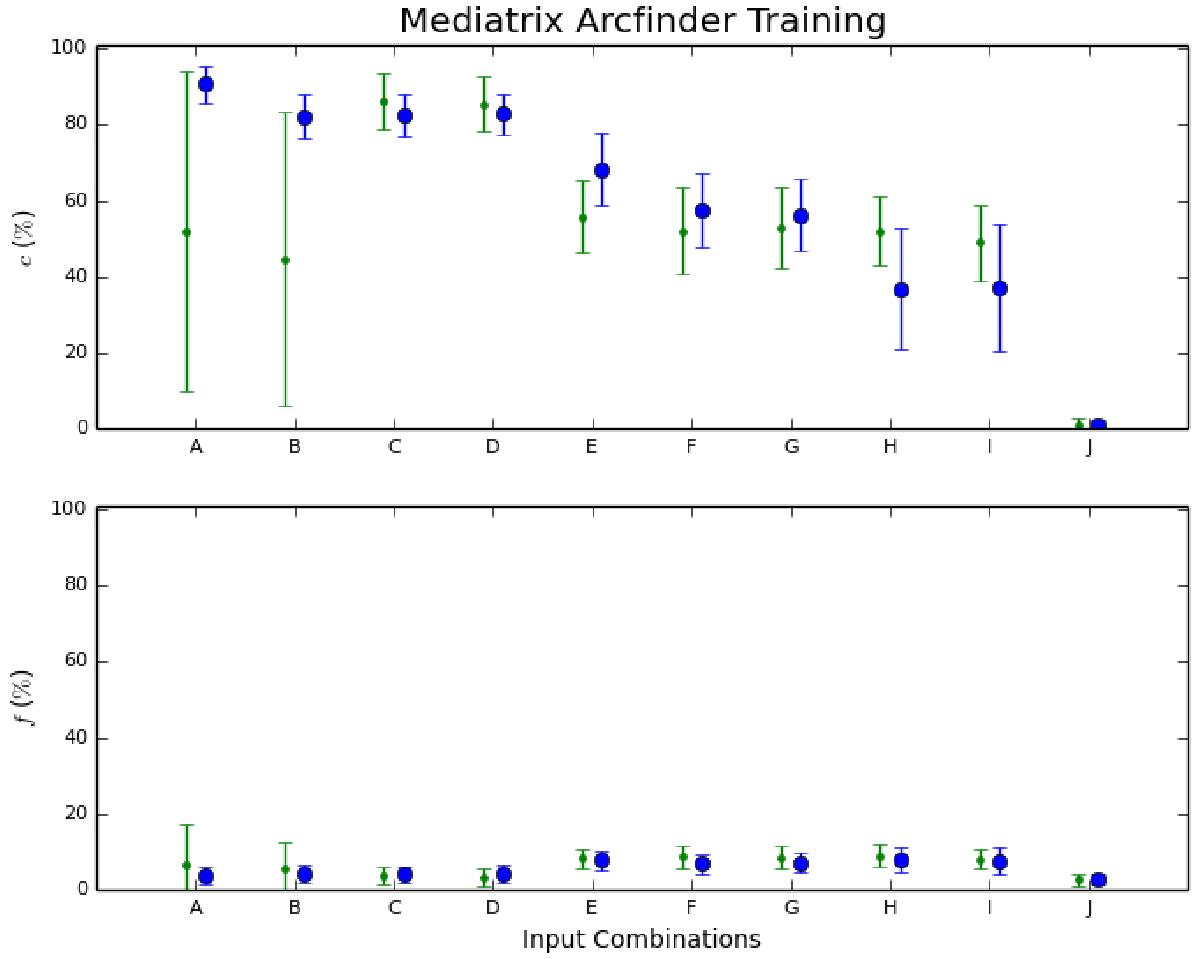
Mean completeness ![]() and false positive fraction
and false positive fraction ![]() for the different sets of inputs (for threshold t = 0). The results from the training in pure arcs are shown as large blue dots, while those using images with background and noise are shown as small green dots. The error bars are the standard deviation from the sets of training plus validation subsamples. We shifted the symbols horizontally for the two types of input images for clarity.
for the different sets of inputs (for threshold t = 0). The results from the training in pure arcs are shown as large blue dots, while those using images with background and noise are shown as small green dots. The error bars are the standard deviation from the sets of training plus validation subsamples. We shifted the symbols horizontally for the two types of input images for clarity.
Current usage metrics show cumulative count of Article Views (full-text article views including HTML views, PDF and ePub downloads, according to the available data) and Abstracts Views on Vision4Press platform.
Data correspond to usage on the plateform after 2015. The current usage metrics is available 48-96 hours after online publication and is updated daily on week days.
Initial download of the metrics may take a while.