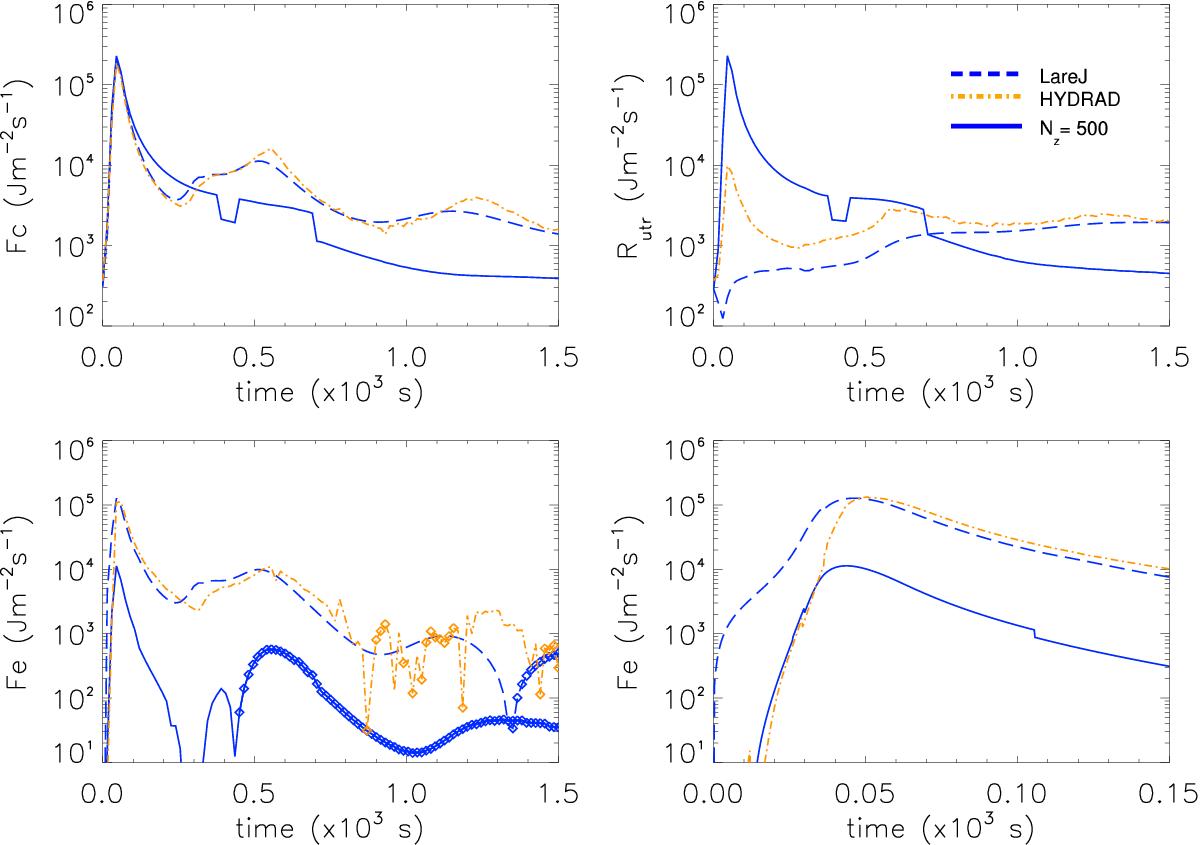
Fig. 5

Results for Case 9. The panels show the heat flux at the top of UTR, IRL in the UTR and enthalpy flux over two different time intervals at the top of the UTR (lines connected by diamond symbols indicate where the enthalpy flux is downflowing and lines without diamonds indicate where the enthalpy flux is upflowing) as functions of time. The dashed blue line is the LareJ solution (that is computed with 500 grid points along the length of the loop), the solid blue line is the Lare1D solution that is computed with 500 grid points along the length of the loop and the dot-dashed orange line corresponds to the HYDRAD solution.
Current usage metrics show cumulative count of Article Views (full-text article views including HTML views, PDF and ePub downloads, according to the available data) and Abstracts Views on Vision4Press platform.
Data correspond to usage on the plateform after 2015. The current usage metrics is available 48-96 hours after online publication and is updated daily on week days.
Initial download of the metrics may take a while.


