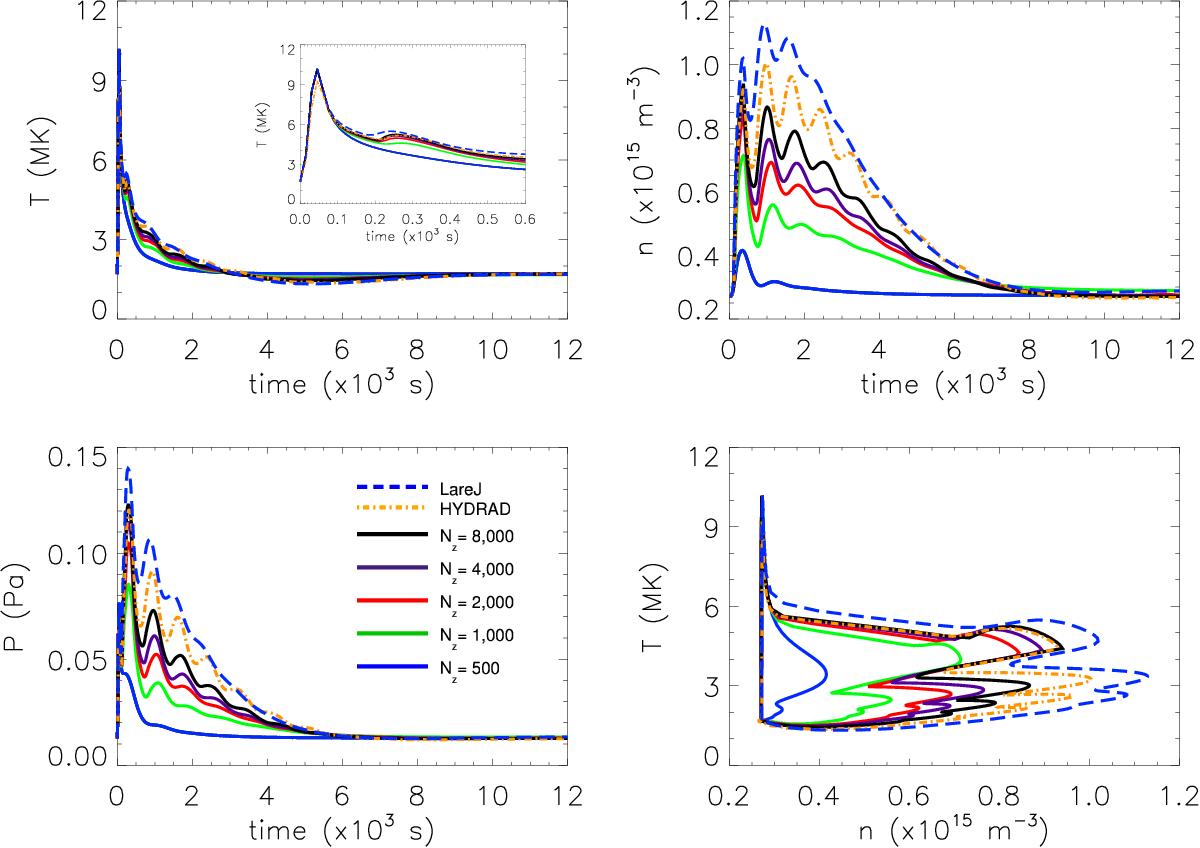
Fig. 4

Results for Case 9. The panels show the coronal averaged temperature, density and pressure as functions of time, and the temperature versus density phase space plot. The solid lines represent the Lare1D solutions obtained by using different numbers of grid points along the length of the loop, the dashed blue line is the LareJ solution (that is computed with the same spatial resolution as the solid blue curve) and the dot-dashed orange line corresponds to the HYDRAD solution.
Current usage metrics show cumulative count of Article Views (full-text article views including HTML views, PDF and ePub downloads, according to the available data) and Abstracts Views on Vision4Press platform.
Data correspond to usage on the plateform after 2015. The current usage metrics is available 48-96 hours after online publication and is updated daily on week days.
Initial download of the metrics may take a while.


