Fig. 7
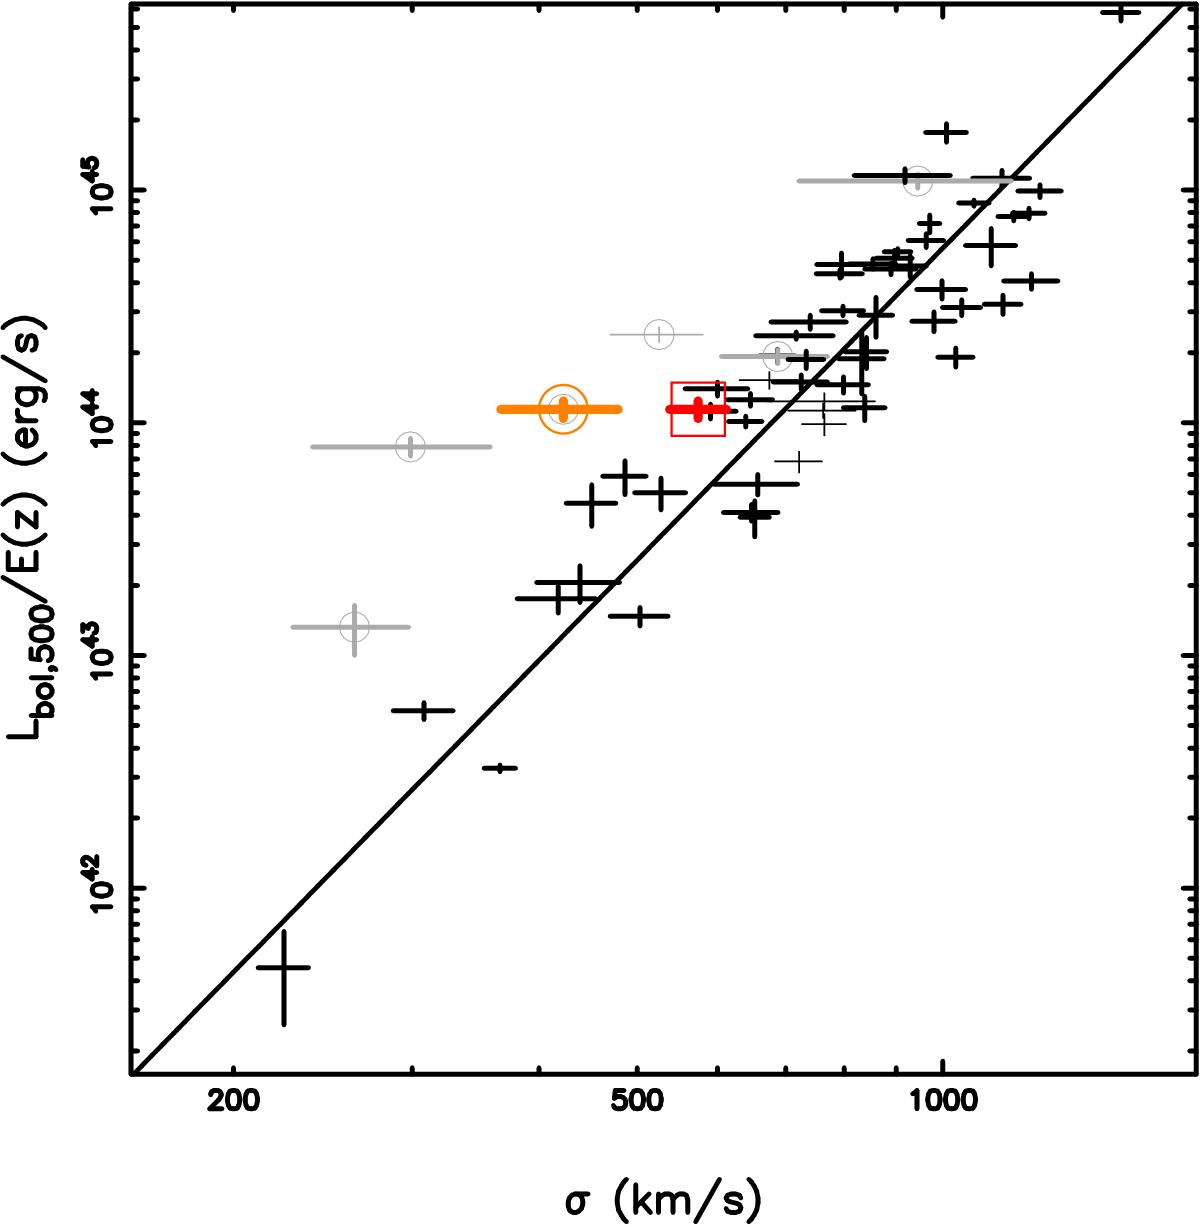
![]() diagram of the HIFLUGCS clusters, in which the best fit is for those 56 clusters with more than 45 spectroscopic members per cluster. The orange circle and red box show the original (Zhang et al. 2011) and the revised values from this work, respectively, for S1101. Clusters with less than 45 spectroscopic members are shown as grey circles.
diagram of the HIFLUGCS clusters, in which the best fit is for those 56 clusters with more than 45 spectroscopic members per cluster. The orange circle and red box show the original (Zhang et al. 2011) and the revised values from this work, respectively, for S1101. Clusters with less than 45 spectroscopic members are shown as grey circles.
Current usage metrics show cumulative count of Article Views (full-text article views including HTML views, PDF and ePub downloads, according to the available data) and Abstracts Views on Vision4Press platform.
Data correspond to usage on the plateform after 2015. The current usage metrics is available 48-96 hours after online publication and is updated daily on week days.
Initial download of the metrics may take a while.