Fig. 6
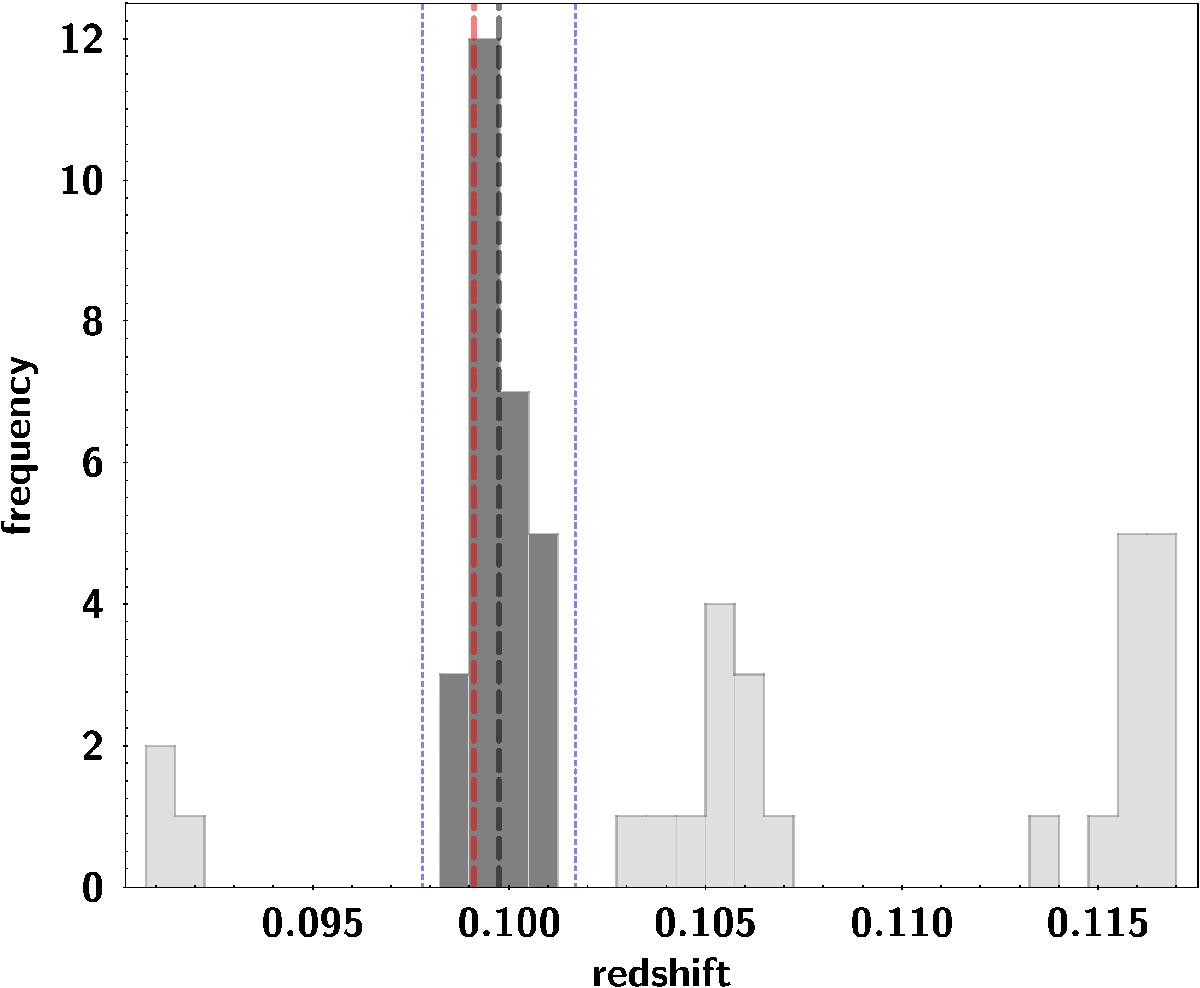
Redshift histogram of the sample S1 around z ~ 0.1. The dotted blue vertical lines refer to the borders of the final clipping, while the actual members of the sample S2 are shown as a dark shaded region. The redshift of galaxy group LCLG −42 230 is indicated by a black and red vertical line, based on our sample S2 and previous work of Tucker et al. (2000), respectively. The definition of S1 and S2 are given in Sect. 6; the corresponding data are listed in Appendix A.
Current usage metrics show cumulative count of Article Views (full-text article views including HTML views, PDF and ePub downloads, according to the available data) and Abstracts Views on Vision4Press platform.
Data correspond to usage on the plateform after 2015. The current usage metrics is available 48-96 hours after online publication and is updated daily on week days.
Initial download of the metrics may take a while.