Fig. 5
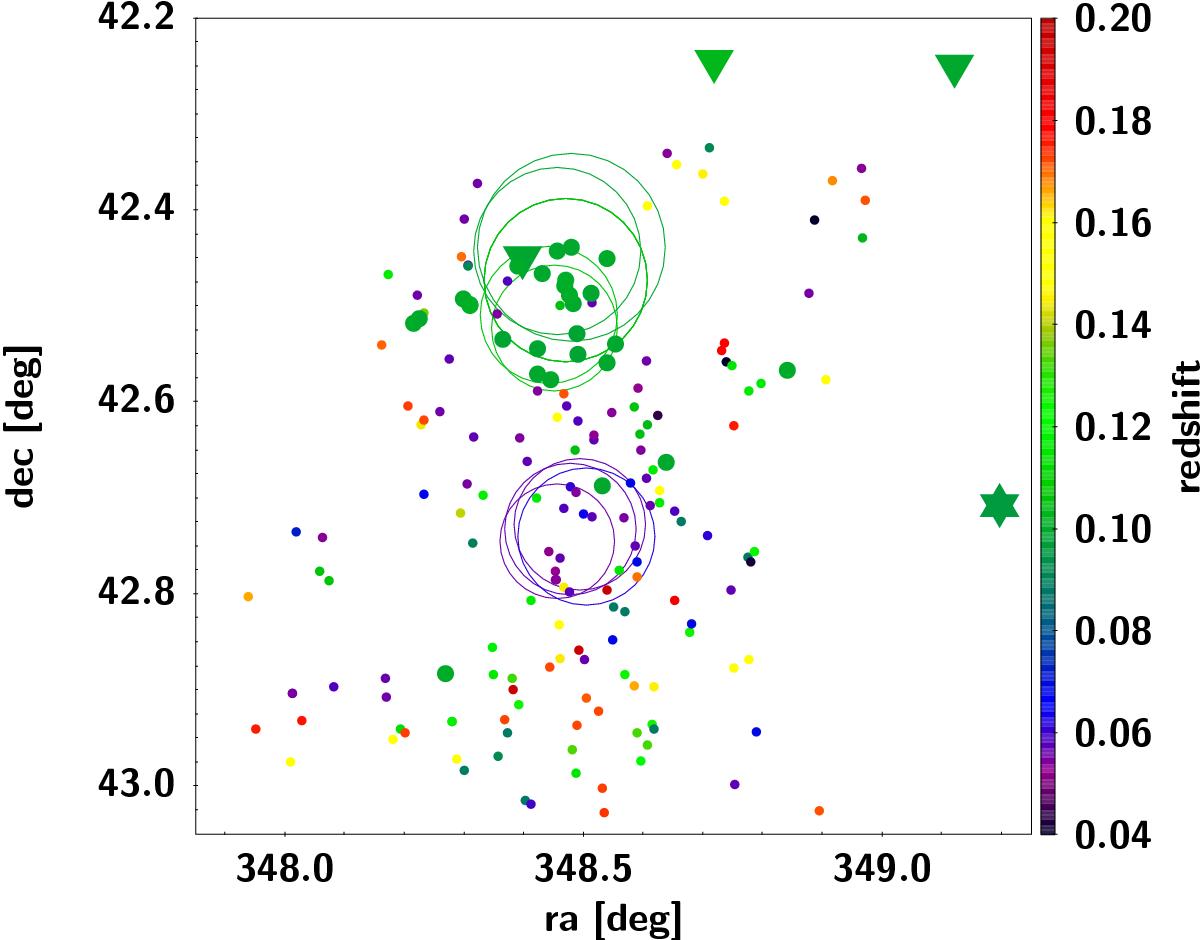
Dressler-Shectman plot of our spectroscopic sample S0. Symbol size scales with ![]() above a threshold of δi = 3, below that value galaxies are shown as simple dots, and the sample S2 is emphasized by larger green dots. Filled triangles and the filled star symbolize the central regions of galaxy groups and one galaxy cluster found in the vicinity of our survey field, as listed in the NED. The colour of each symbol corresponds to the redshift of the respective source.
above a threshold of δi = 3, below that value galaxies are shown as simple dots, and the sample S2 is emphasized by larger green dots. Filled triangles and the filled star symbolize the central regions of galaxy groups and one galaxy cluster found in the vicinity of our survey field, as listed in the NED. The colour of each symbol corresponds to the redshift of the respective source.
Current usage metrics show cumulative count of Article Views (full-text article views including HTML views, PDF and ePub downloads, according to the available data) and Abstracts Views on Vision4Press platform.
Data correspond to usage on the plateform after 2015. The current usage metrics is available 48-96 hours after online publication and is updated daily on week days.
Initial download of the metrics may take a while.