Fig. 4
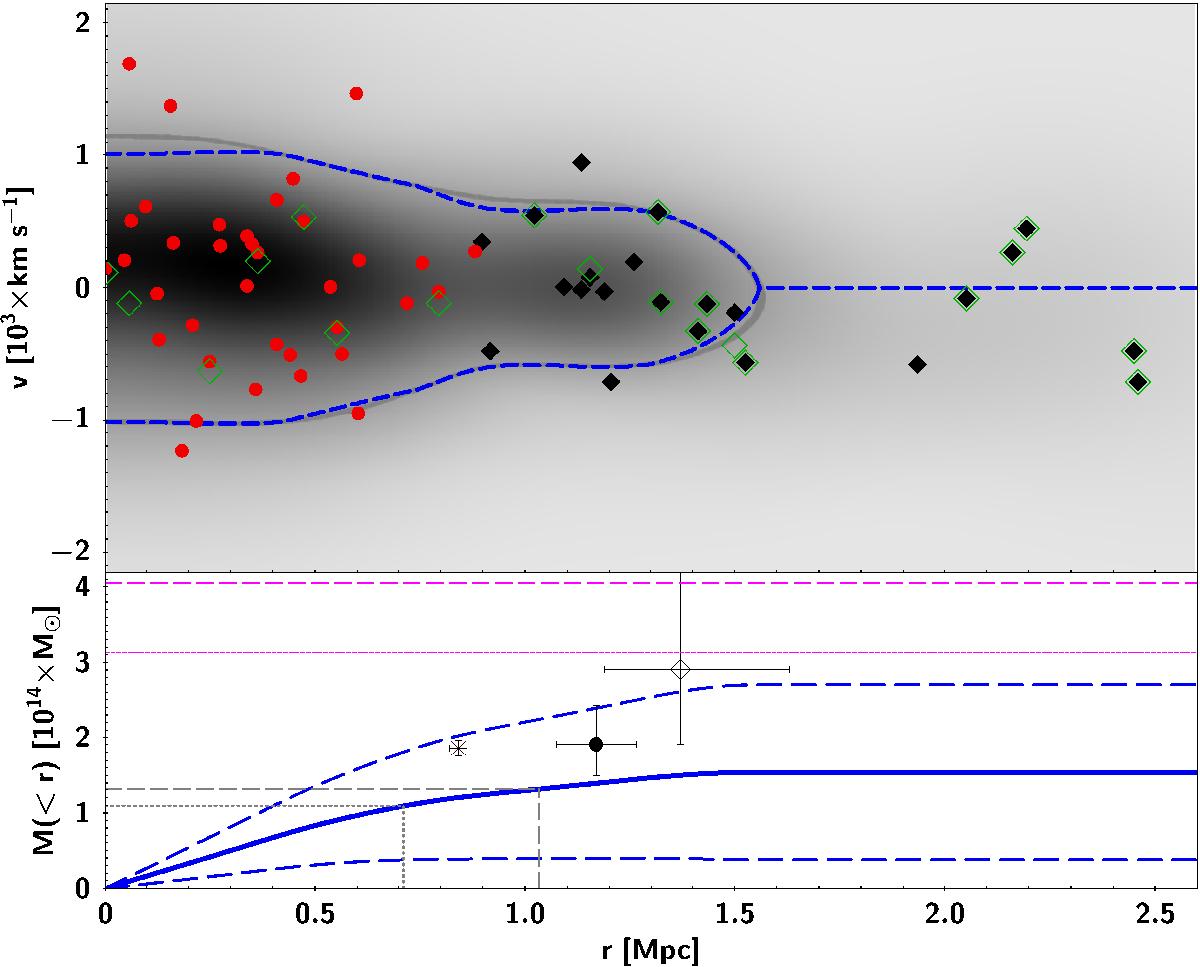
Upper panel: diagram of relative line-of-sight velocity vs. projected cluster centric distance of the candidate member galaxies in S1101. Grey shadow shows the fq(r,v) contours. The thick grey curve highlights the equal-density curve of fq(r,v) = κ. Red circles and black diamonds indicate galaxies within and beyond r = 0.896 Mpc (used for constraining κ), respectively. The blue dashed curve refers to the estimated caustic of the cluster, hence all galaxies with their velocities beyond are excluded from the member sample in this method. Green open diamonds highlight cluster members previously known in the literature. Lower panel: mass profile of S1101. The mass profile from the caustic method (see Sect. 3.5) is shown as a blue thick curve, where the blue dashed curves show the corresponding 1σ error estimate. The grey dashed and dotted lines trace the measured positions of ![]() and
and ![]() for Δ = { 500,200 }, respectively, according to the caustic mass distribution. For comparison, we overplot the dynamical mass M200 derived from the velocity dispersion according to Munari et al. (2013) as large black dot, the X-ray mass estimates M500 (Zhang et al. 2011) and
for Δ = { 500,200 }, respectively, according to the caustic mass distribution. For comparison, we overplot the dynamical mass M200 derived from the velocity dispersion according to Munari et al. (2013) as large black dot, the X-ray mass estimates M500 (Zhang et al. 2011) and ![]() (Reiprich & Böhringer 2002) as black X and open diamond, respectively, and the SZ mass proxy as a dashed line with its lower error interval as dotted lines in magenta. Values of all mass proxies are also given in Table 2.
(Reiprich & Böhringer 2002) as black X and open diamond, respectively, and the SZ mass proxy as a dashed line with its lower error interval as dotted lines in magenta. Values of all mass proxies are also given in Table 2.
Current usage metrics show cumulative count of Article Views (full-text article views including HTML views, PDF and ePub downloads, according to the available data) and Abstracts Views on Vision4Press platform.
Data correspond to usage on the plateform after 2015. The current usage metrics is available 48-96 hours after online publication and is updated daily on week days.
Initial download of the metrics may take a while.