Fig. 1
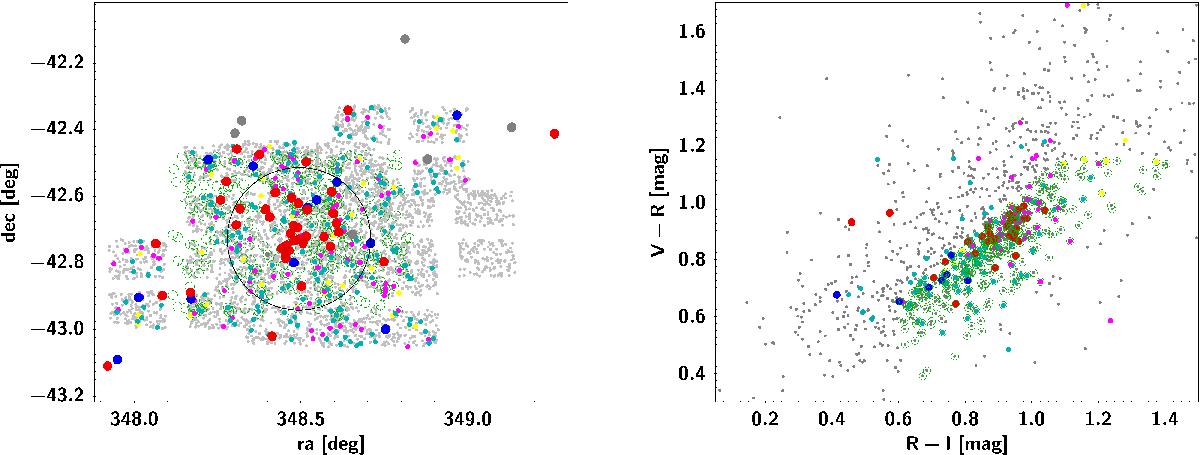
Skypositions (left panel) and WFI colour–colour diagram (right panel) of the objects in the cluster field of S1101. Small grey dots show all sources detected from the VIMOS pre-imaging and the WFI imaging for the left and the right panel, respectively. Green circles indicate WFI colour–colour selected candidates for the spectroscopic follow-up. The imaging candidates that were spectroscopically observed but classified as non-members are indicated with magenta and cyan dots for galaxies with passive and active spectral types and yellow dots for stars. Large dots in red, blue, and grey correspond to spectroscopically verified cluster members with passive, active, and unknown spectral types. The black cross denotes the cluster X-ray centre. The big black circle shows the area within a projected distance of r500. Because of bad weather, the spectroscopic follow-up shows an artificial elongation along the southeast-northwest direction as not all scheduled VIMOS pointings in the cluster field were performed.
Current usage metrics show cumulative count of Article Views (full-text article views including HTML views, PDF and ePub downloads, according to the available data) and Abstracts Views on Vision4Press platform.
Data correspond to usage on the plateform after 2015. The current usage metrics is available 48-96 hours after online publication and is updated daily on week days.
Initial download of the metrics may take a while.