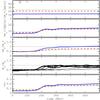
Fig. 9
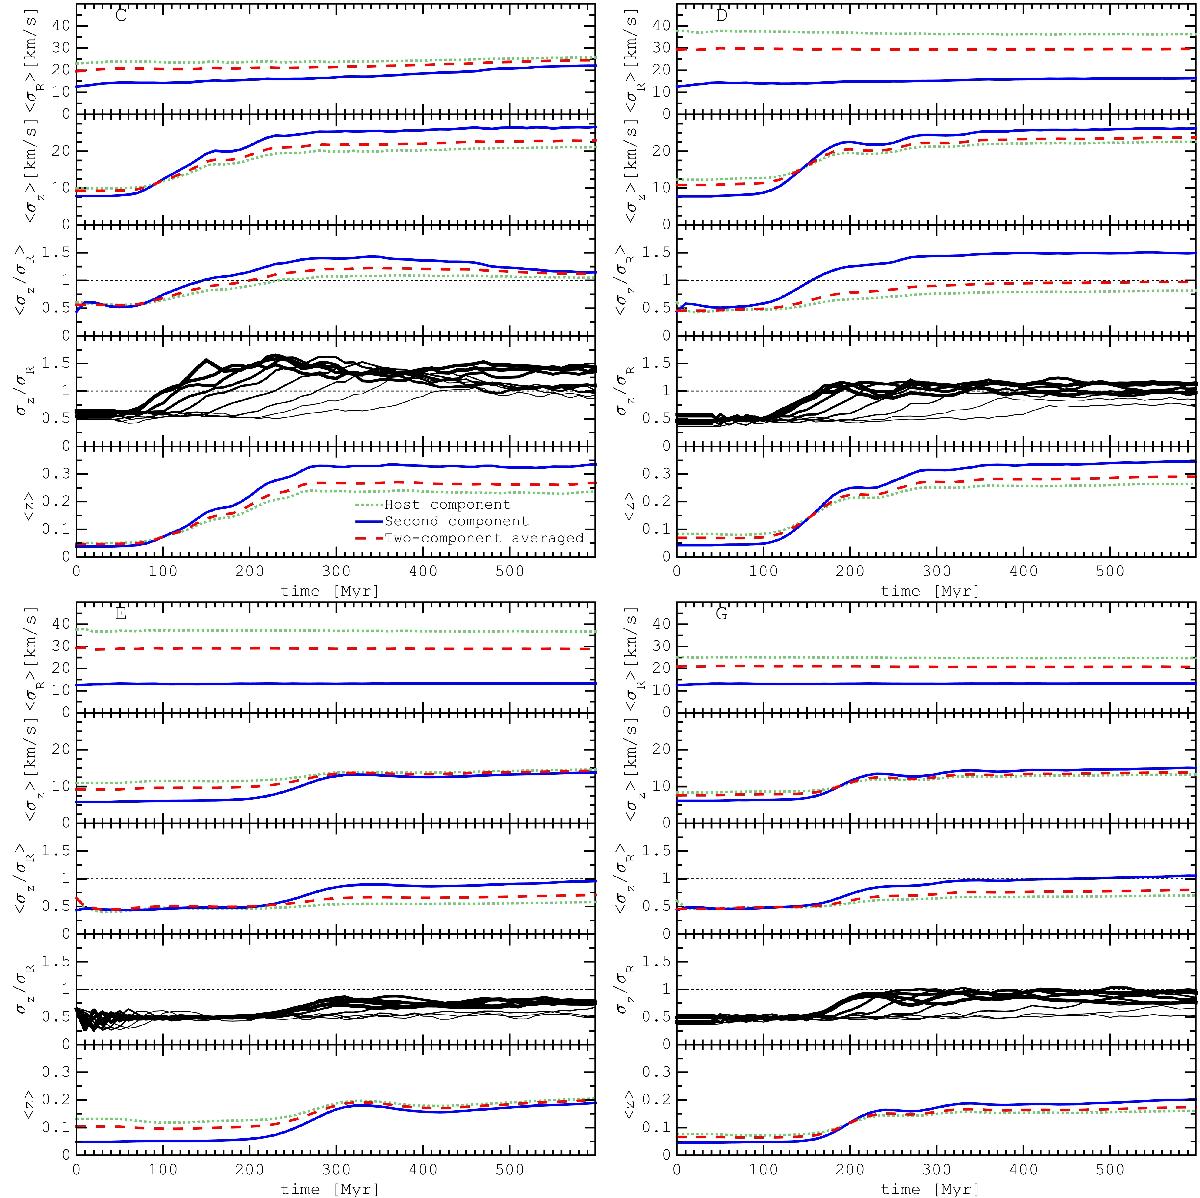
Evolution of the disk parameters, in the same format as in Fig. 4, for four models with counterrotation. Black lines in the fourth frame of each of the four panels show the evolution of two-component averaged values of the velocity dispersion ratio σz/σR at various radii (line thickness decreases with radial distance from the center).
Current usage metrics show cumulative count of Article Views (full-text article views including HTML views, PDF and ePub downloads, according to the available data) and Abstracts Views on Vision4Press platform.
Data correspond to usage on the plateform after 2015. The current usage metrics is available 48-96 hours after online publication and is updated daily on week days.
Initial download of the metrics may take a while.