Fig. 8
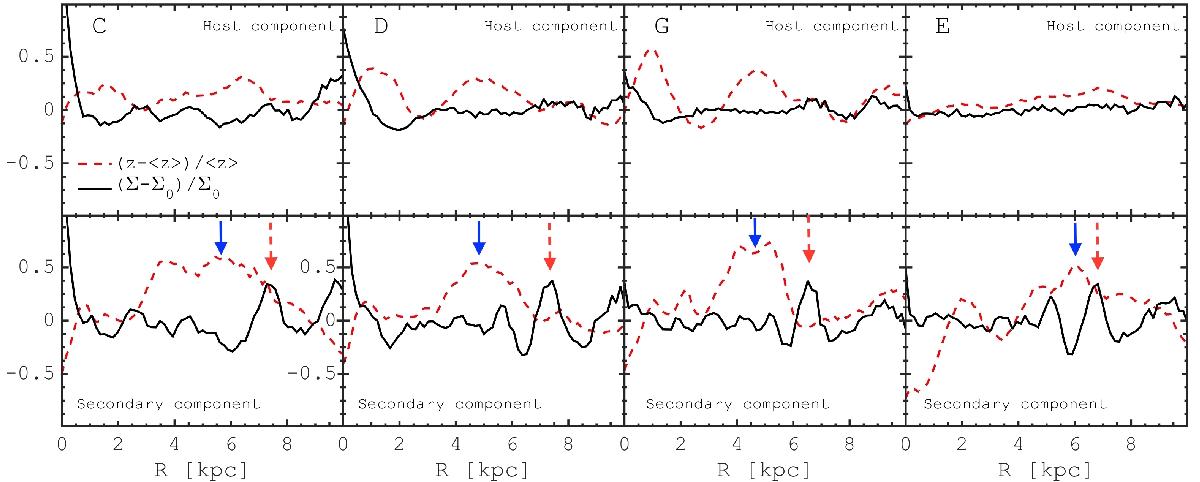
Radial profiles of relative perturbations of the disk thickness (dashed red line) and surface density (solid black line) for the four models with counterrotation (same models as in Fig. 7). Top row shows the data for the host component, bottom row for the secondary component of the simulated galaxy. Blue solid vertical arrows show the position of the bending wave peak. Red dashed vertical arrows show the location of the most prominent ring structure (see also Fig. 7). In model C, rings are present, but they are connected with the one-armed spiral structure. In all models the ring structure is strongest in the outer parts of the bending wave.
Current usage metrics show cumulative count of Article Views (full-text article views including HTML views, PDF and ePub downloads, according to the available data) and Abstracts Views on Vision4Press platform.
Data correspond to usage on the plateform after 2015. The current usage metrics is available 48-96 hours after online publication and is updated daily on week days.
Initial download of the metrics may take a while.