Fig. 4
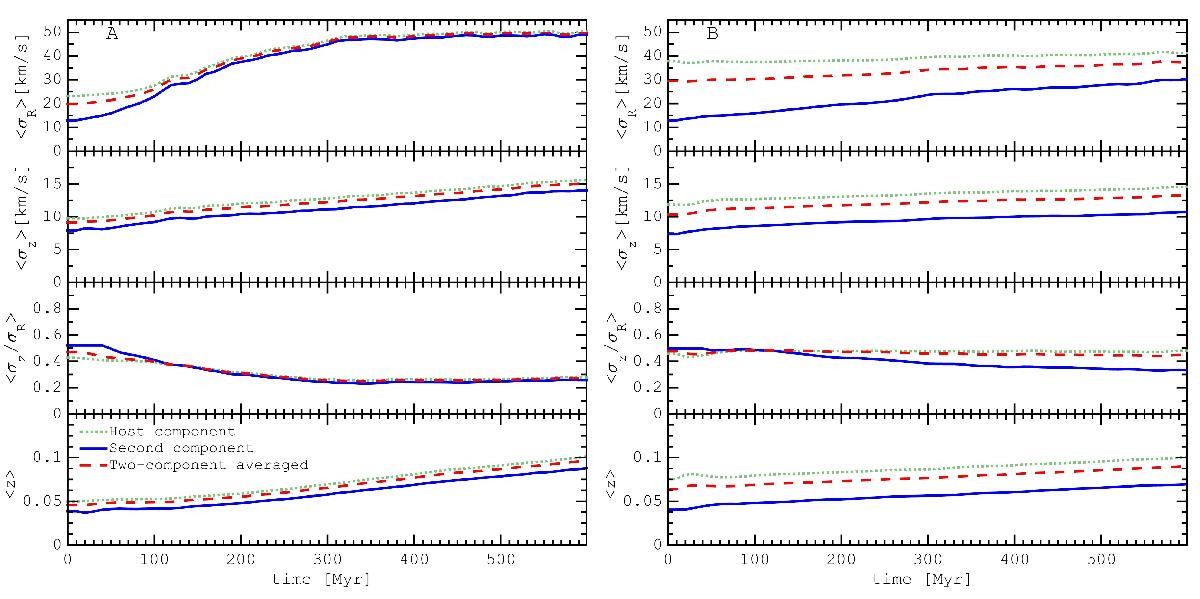
Evolution of the disk parameters: radial velocity dispersion ⟨ σR1 ⟩, ⟨ σR2 ⟩, ⟨ σR ⟩ (first row), vertical velocity dispersion ⟨ σz1 ⟩, ⟨ σz2 ⟩, ⟨ σz ⟩ (second row), vertical-to-radial velocity dispersion ratio ⟨ σz1/σR1 ⟩, ⟨ σz2/σR2 ⟩, ⟨ σz/σR ⟩ (third row), and disk thickness ⟨ z1 ⟩, ⟨ z2 ⟩, ⟨ z ⟩ (bottom row); see Eqs. (4), (5). Blue circles correspond to the secondary (less massive) component, green crosses to the host component, and red squares represent the two-component averaged values. We recall that the two components in these models are co-rotating.
Current usage metrics show cumulative count of Article Views (full-text article views including HTML views, PDF and ePub downloads, according to the available data) and Abstracts Views on Vision4Press platform.
Data correspond to usage on the plateform after 2015. The current usage metrics is available 48-96 hours after online publication and is updated daily on week days.
Initial download of the metrics may take a while.