Fig. 10
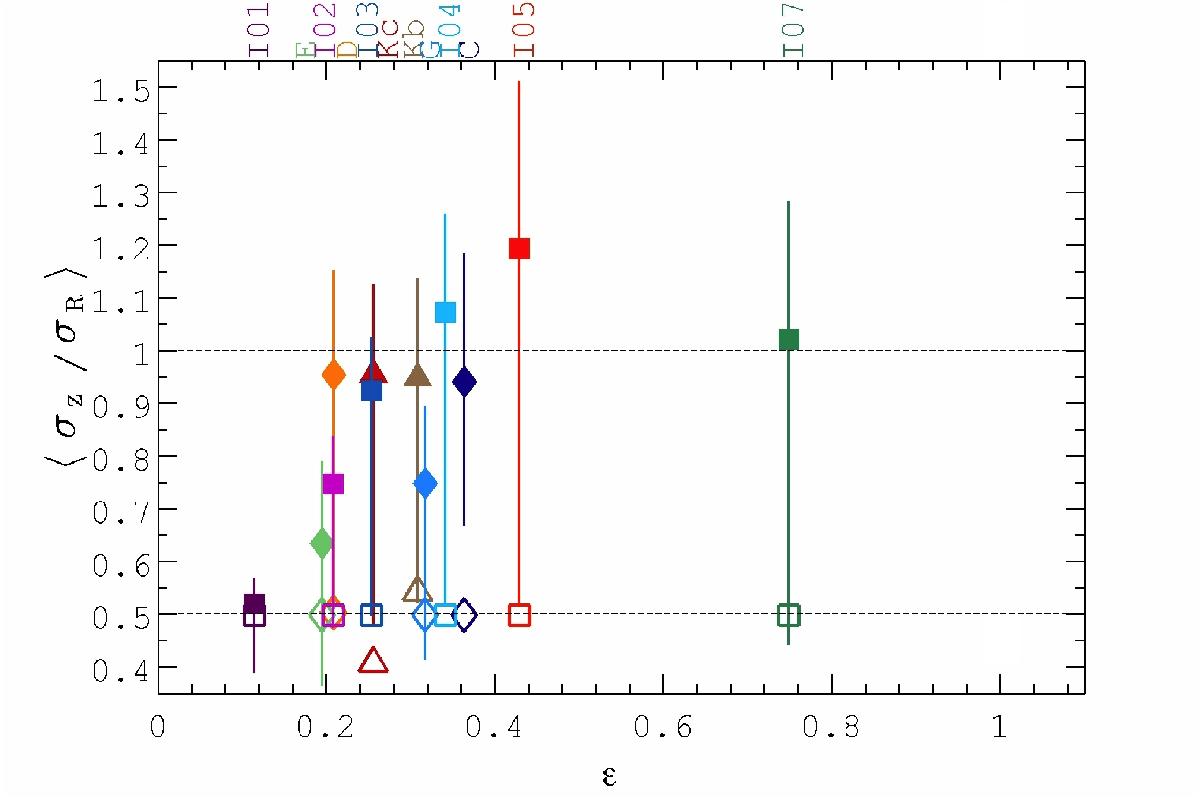
Mean value of the velocity dispersion ratio ⟨ σz/σR ⟩ as a function of ε at ≈ 600–800 Myr (filled symbols) in various models; initial ⟨ σz/σR ⟩ values are shown by open symbols. Different symbols correspond to different groups of models in Table 1: diamonds for models C, D, E, G; squares for models I01, I02, I03, I04, I05, I07; triangles for models Kb and Kc. Model names are shown above the plot. Vertical error bars correspond to the range of the velocity dispersion ratio, which changes with radius in the final evolved state.
Current usage metrics show cumulative count of Article Views (full-text article views including HTML views, PDF and ePub downloads, according to the available data) and Abstracts Views on Vision4Press platform.
Data correspond to usage on the plateform after 2015. The current usage metrics is available 48-96 hours after online publication and is updated daily on week days.
Initial download of the metrics may take a while.