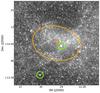
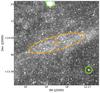
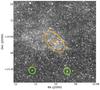
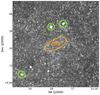
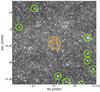
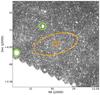
Fig. 9
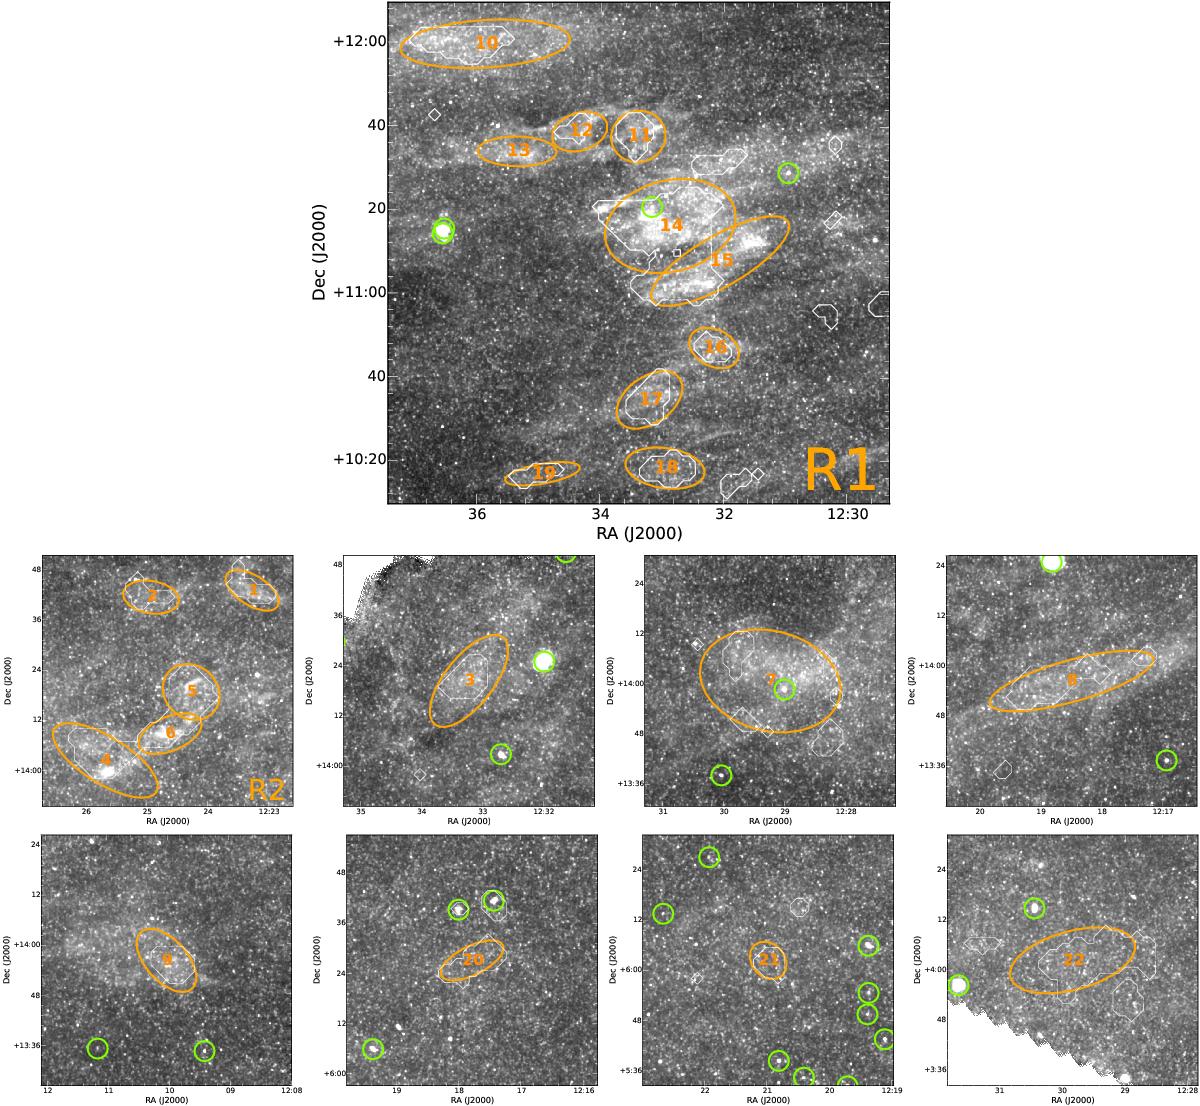
Regions with high positive residuals, superimposed on the SPIRE 250 μm map at the original resolution. For each object detected by sextractor, isophotal ellipses are shown (see Table 3). White contours correspond to regions masked during the emissivity determination. Green circles (diameter = 2 FWHM) show the VCC galaxies detected by Auld et al. (2013). The size of the R1 panel is 2° × 2°, 1° × 1° for all the others.
Current usage metrics show cumulative count of Article Views (full-text article views including HTML views, PDF and ePub downloads, according to the available data) and Abstracts Views on Vision4Press platform.
Data correspond to usage on the plateform after 2015. The current usage metrics is available 48-96 hours after online publication and is updated daily on week days.
Initial download of the metrics may take a while.