Fig. 8
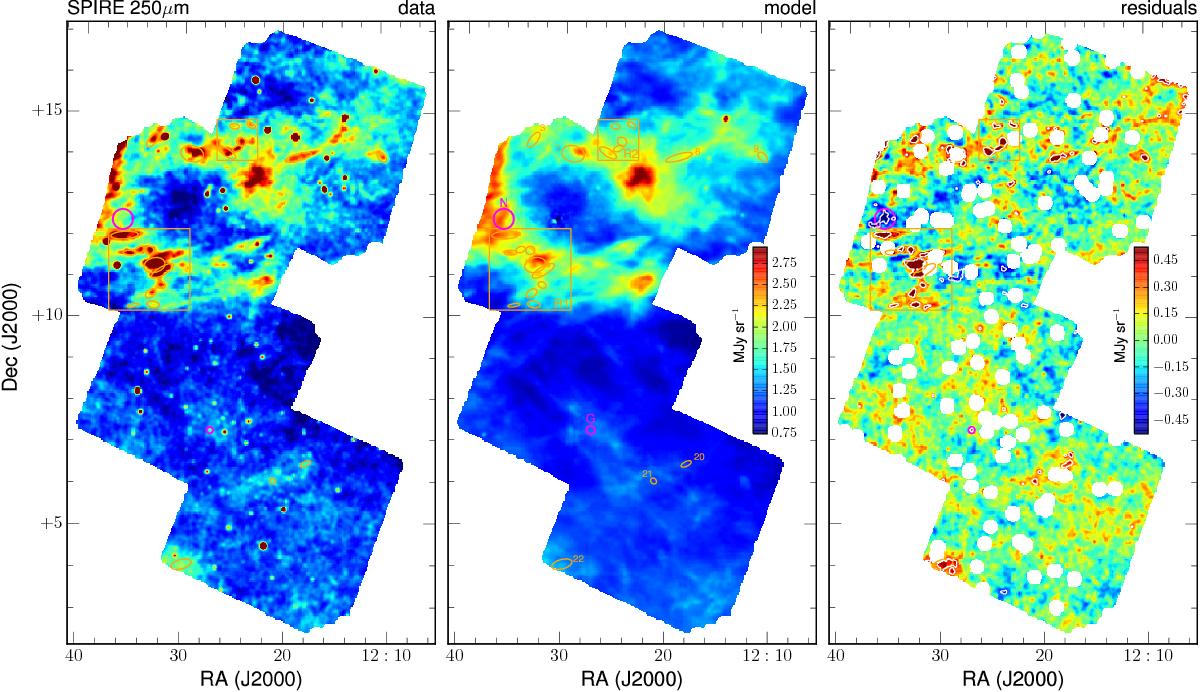
Observations (left column), models (middle column), and residuals (right column) of the HeViCS field in the SPIRE 250 μm band. Observations and models were subtracted by the large-scale terms Oν + Eν × (b−b0) and are shown on the same color scale. The color scale of the residuals goes from −4 to 4σR (Table 1); round white areas show the object mask applied before the fitting, while white contours encircle the regions where residuals are larger than 3σR (excluded during the fitting). The orange numbered ellipses and square regions refer to the high positive residual regions listed in Table 3 and shown in Fig. 9. The magenta circle labeled “N” highlights a region with high negative residuals; the magenta circle labeled “G” is centered on an unmasked Virgo cluster galaxy.
Current usage metrics show cumulative count of Article Views (full-text article views including HTML views, PDF and ePub downloads, according to the available data) and Abstracts Views on Vision4Press platform.
Data correspond to usage on the plateform after 2015. The current usage metrics is available 48-96 hours after online publication and is updated daily on week days.
Initial download of the metrics may take a while.