Fig. 7
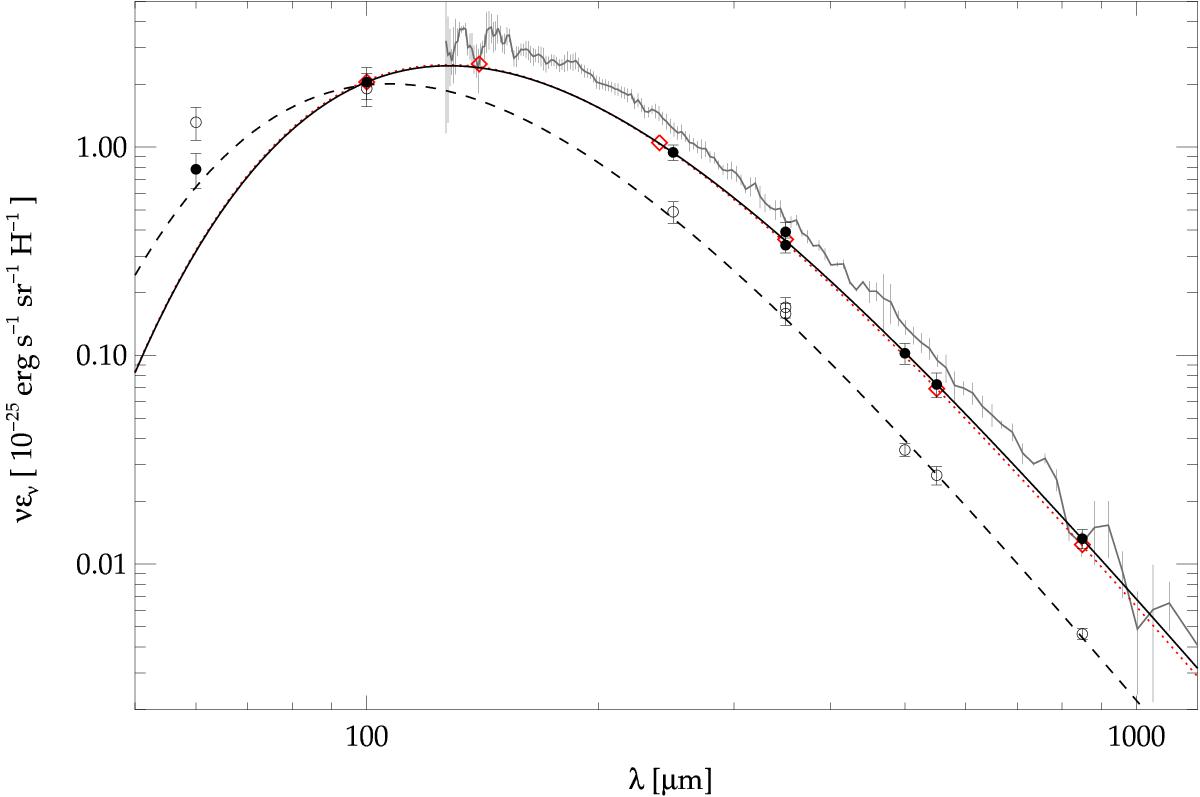
Mean emissivities for the full HeViCS coverage. Filled circles and solid lines refer to the estimates for ϵLVC and their (variable β) MBB fits, respectively; open circles and dashed lines refer to ϵIVC. The error bars show the standard deviation of the mean. The red squares are the COBE-DIRBE and Planck-HFI emissivities derived in the southern Galactic pole (Planck Collaboration Int. XVII 2014); the red dotted line is the fit to Planck high-latitude emissivities (Planck Collaboration XI 2014); the gray line and error bars refer to the high-latitude emissivities from FIRAS (Compiègne et al. 2011).
Current usage metrics show cumulative count of Article Views (full-text article views including HTML views, PDF and ePub downloads, according to the available data) and Abstracts Views on Vision4Press platform.
Data correspond to usage on the plateform after 2015. The current usage metrics is available 48-96 hours after online publication and is updated daily on week days.
Initial download of the metrics may take a while.