Fig. 4
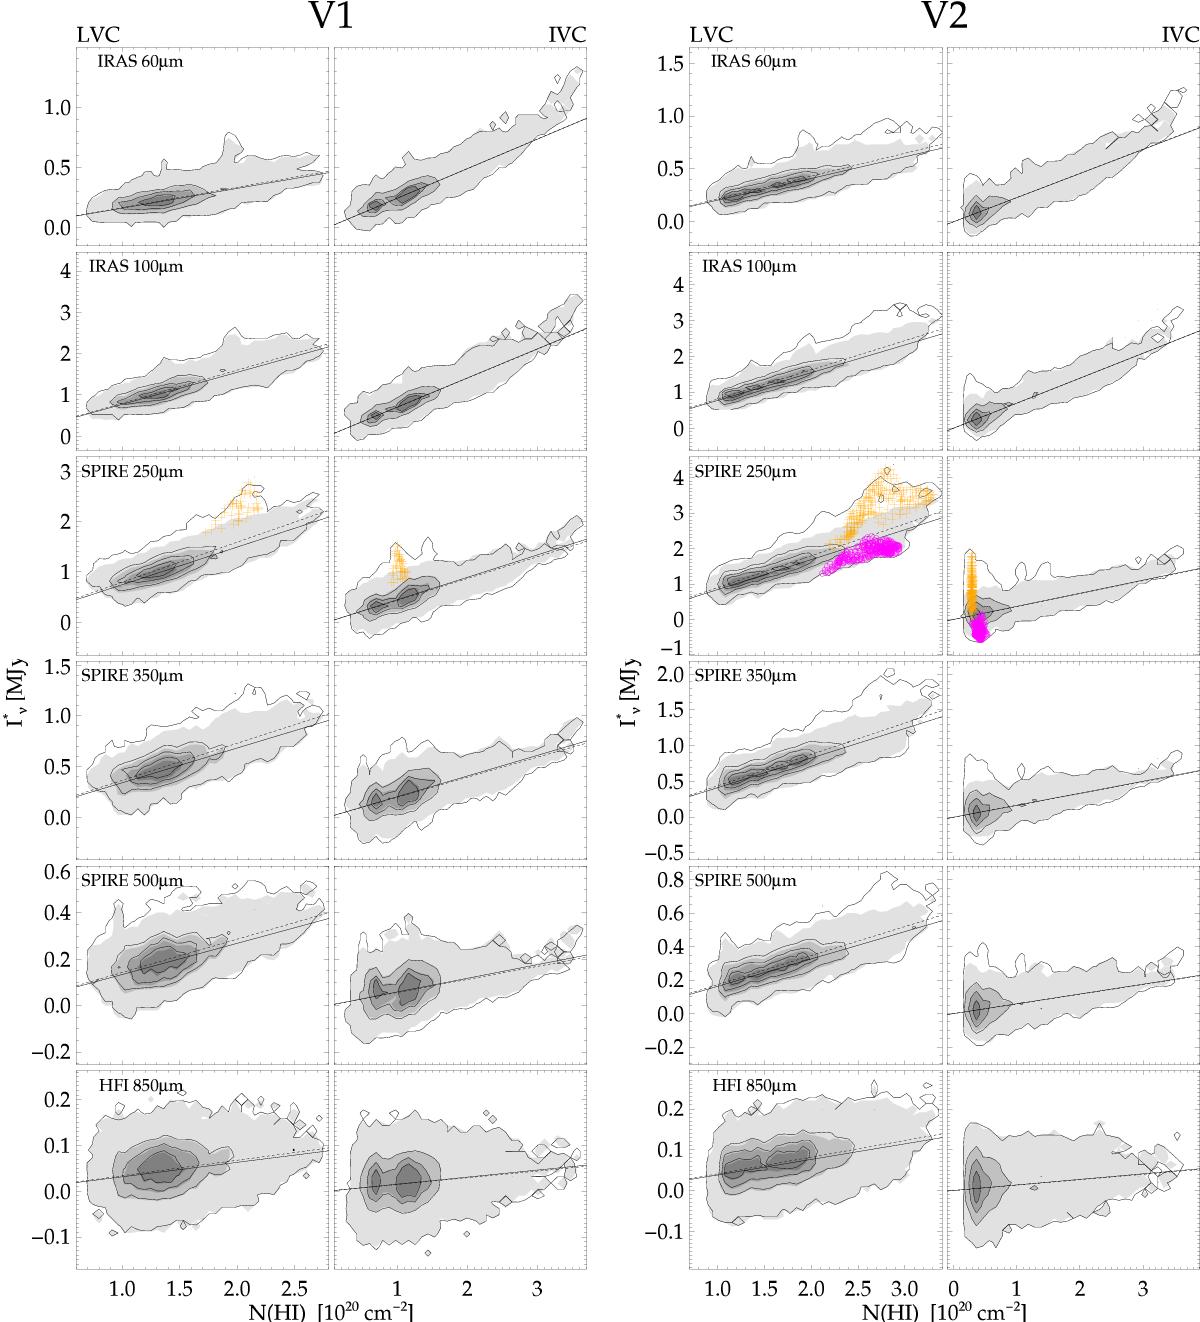
Pixel-by-pixel correlation between dust emission and atomic gas column density for field V1 and V2 in the IRAS, SPIRE, and Planck-HFI 850 μm bands. For the LVC (IVC) gas component, the dust surface brightness ![]() is corrected to exclude the fitted contribution of the IVC (LVC) component; also, the offset and ecliptic latitude component is removed. Contours of constant pixel density enclosing 99.9, 75, 50, and 25% of the pixels are plotted. The gray-scale filled contours show the same correlation after masking regions that are deviant from the model by more than 3σR at 250 μm. Solid and dashed lines show the fitted correlation before and after the masking, respectively. Small changes in the fitted Oν before and after the masking result in slight displacements of the line and filled contours. Orange crosses in the 250 μm panels refer to pixels within the isophotal ellipses of object 6 (in V1) and 14 (in V2). Magenta circles in the V2 250 μm panels show the region “N” of negative residuals (see Sect. 6 for details).
is corrected to exclude the fitted contribution of the IVC (LVC) component; also, the offset and ecliptic latitude component is removed. Contours of constant pixel density enclosing 99.9, 75, 50, and 25% of the pixels are plotted. The gray-scale filled contours show the same correlation after masking regions that are deviant from the model by more than 3σR at 250 μm. Solid and dashed lines show the fitted correlation before and after the masking, respectively. Small changes in the fitted Oν before and after the masking result in slight displacements of the line and filled contours. Orange crosses in the 250 μm panels refer to pixels within the isophotal ellipses of object 6 (in V1) and 14 (in V2). Magenta circles in the V2 250 μm panels show the region “N” of negative residuals (see Sect. 6 for details).
Current usage metrics show cumulative count of Article Views (full-text article views including HTML views, PDF and ePub downloads, according to the available data) and Abstracts Views on Vision4Press platform.
Data correspond to usage on the plateform after 2015. The current usage metrics is available 48-96 hours after online publication and is updated daily on week days.
Initial download of the metrics may take a while.